
Value Investing
Value investing is a concept of buying and selling stocks based on business fundamentals and not as a reaction to news or market trends. It is a well-accepted principle that often the market overreacts to news, causing stocks to plummet in price or escalate in value. Value investors ignore this and use sound business fundamentals to trade stocks. Much of historical wealth accumulation is based on value investments. There are no shortcuts or sudden actions taken by value investors. All decisions are derived from business analytics and trend lines.
The best example of a value investor is Warren Buffett; he is considered the wealthiest and smartest investor to date.
The best aspect of value investing is that it eliminates emotional trading. It is strictly a business-based model.
There are other definitions for value investing, and they include:
- Trading based on book value,
- Intrinsic value acts as the underlying business fundamental,
- Fundamental analysis is the basis for the decision model.
The concept was first coined by Benjamin Graham and David Dodd back in the 1930s in their co-authored book Security Analysis. Their basic formula is Value equals Earnings times (8.5 + 2 times the average expected annual growth rate over the next seven to ten years). For example, General Motors earned $5.53 per share in 2018. Assume that General Motors’ growth rate will be around half of a percent per year for the next seven years. The resulting formula is as follows:
Value per Share = Earnings(8.5 + 2(Avg. Growth Rate) = 5.53[(8.5 + 2(.5%)] = 5.53 (8.5 + 1) = 5.53(9.5) = $52.54 per share.
Thus, if the current market price per share is less than $52.54, then General Motors is a good buy. More than $52.54, a holder would sell to profit from the higher value. The current price per share for GM is $36.60 as of March 25, 2019.
Based on the formula, even with a zero growth rate, GM’s current price would appear to be a good value. However, Graham and Dodd’s formula has evolved over the last 85 years and is used as a starting point with evaluating securities. Other tools are used. Value investors use a complicated analytical approach to set buy and sell points for stocks. Let’s continue with GM.
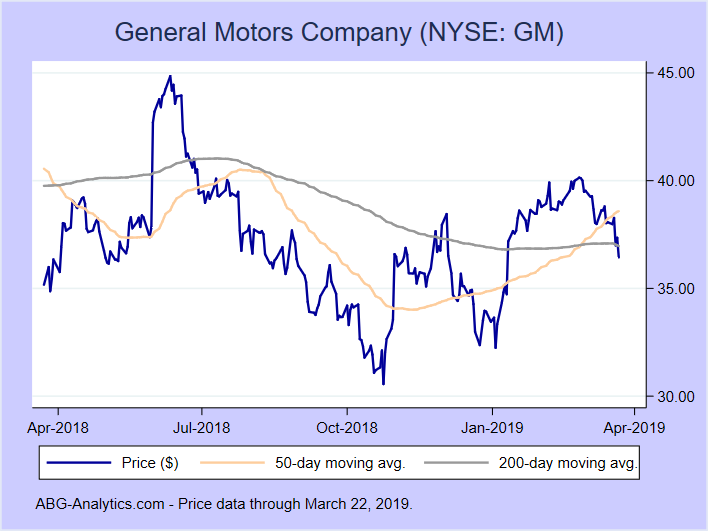 Back in June of 2018, the market price per share hit $44. GM’s price per share fluctuated between $44.85 (June 2018) and $30.56 (October 24, 2018). A value investor would buy shares once the price hits a certain low target and sell at a higher point. As an example, a value investor’s thought process after analytical work would buy anytime the stock went below $33 and sell when it was higher than $38 a share during that period. Let’s do some math:
Assume an investor decides to invest $2,500 into GM as a value investment. The investor agrees to buy at some point during the past year when the stock is below $33 per share and sell at any point if the stock goes in excess of $38 per share. Assume transaction costs are 3.5% each time.
On October 8, 2018, GM’s sale price dipped to $32.65 per share. With a 3.5% transaction fee, each share costs the investor $33.79, so the investor buys 73.98 shares of stock costing him exactly $2,500.00.
On December 3rd, about 57 days later, the price per share reached $38.45, and the value investor proceeded to sell all 73.98 shares. Here’s the math:
Gross Sales Price – 73.98 * 38.45 = $2,844.53
Cost to Sell @ 3.5% = 99.59
Net Proceeds = $2,744.94
Cost of Stock = 2,500.00
Net Realized Gain = $244.94
This is a whopping 9.79% return on his investment over 57 days, or an annualized return of 62.69%. This is an excellent investment, all things considered.
What is really fascinating is that on December 21, 2018, the stock again dips below $33 per share and on January 17, 2019 hits $38.26. The cycle repeated within 45 days. Twice within one year, this particular stock would have met the value investor’s guidelines, and the investor would have reaped good rewards for his patience.
The key is setting the value boundaries. This is done using analytical tools grounded in business ratios.
Value Investing – Analytical Tools
Analytical tools are logical processes used to evaluate a set of data. In effect, you are taking existing information, organizing the information into manageable groups, and then evaluating whether or not the information is helpful. If helpful, the user takes an additional step and assigns the outcome some weighted value. With business analysis, there are hundreds of different tools to use and including:
- SWOT – Strengths, Weaknesses, Opportunities, and Threats
- PEST – Political, Economic, Social, and Technological
- MOST – Mission, Objectives, Strategies, and Tactics
- Business Ratios – Liquidity, Activity, Performance, Leverage, and Valuation
Of the above four, only business ratios are objective. Almost all analytical tools other than business ratios are subjective and thus influenced by expectations. Business ratios look at the past, and using the past as an indicator of the future can predict the future with a high level of confidence.
Business ratios are grouped into five categories:
Within each category, there are no least three business ratios. A user of ratios will always have at least one business ratio from each group in the decision model built. A sophisticated user will utilize two to three business ratios from each group and give the respective ratios a weighted value depending on the nature of the industry.
As an example, an investor desires to compare six electric utility companies. Electric utility companies are relatively stable operations with a monopolistic position in the market, i.e., they control a geographic area in the country. All of them pay out dividends to the shareholders; this is why they are common investments in what is referred to as widow/orphan funds. These are funds that buy shares of companies for security and dividend value.
Assuming no single electric utility has an advantage in acquiring the best engineers, i.e., most engineers will be hired among the six companies equally, as will the other types of employees, then no single electric utility company has a distinct knowledge advantage over others related to employees. What remains are functions of operations based on the types of electric production and costs to produce the energy, along with the price tag that the publicly appointed governing body allows for utility charges to the consumer. The investor is looking for the spread between the costs of electric generation against the revenue for electric generation, commonly referred to as gross profit. Thus, production-based ratios, i.e., the performance ratios, have the greatest value to the investor.
The second most important category is the valuation ratios. Valuation ratios are the market-driven results related to operations. These ratios compare the price of a share of stock to that same share’s ability to generate earnings, sales, and cash flow. For utilities, cash flow is essential in order to reinvest in equipment and pay dividends to the shareholders.
The third most important category is leverage ratios. Why? Electric utilities require constant maintenance and upgrades to electric production in order to keep up with demand and governmental compliance. This costs vast sums of capital via capital expenditures for property, plant, and equipment. Utility companies fund this aspect of the business with both earnings and bonds. Bond interest rates greatly affect the bottom line. Thus, leverage, the use of outside money to fund capital expenditures, plays a pivotal role in the financial outcome of a utility company.
Thus, the investor may have a weighted value matrix as follows for the utility companies’ comparison:
Liquidity Ratios:
. – Operating Cash Ratio 4%
. – Current Ratio 2%
. – Subtotal Liquidity 6%
Activity Ratios:
. – Fixed Assets Turnover 5%
. – Total Assets Turnover 3%
. – Inventory Turnover 2%
. – Subtotal Activity 10%
Leverage Ratios:
. – Interest Coverage 7%
. – Debt Ratio 6%
. – Debt/Equity Ratio 5%
. – Subtotal Leverage 18%
Performance Ratios:
. – Gross Profit Margin 19%
. – Operating Profit Margin 9%
. – Return on Assets 3%
. – Net Profit Margin 4%
. – Subtotal Performance Ratios 35%
Valuation Ratios:
. – Price to Cash Flow 15%
. – Price to Earnings 12%
. – Price to Sales 4%
. – Subtotal Valuation Ratios 31%
Total All Ratios in Matrix 100%
*THE ABOVE IS PURELY AN EXAMPLE AND SHOULD NOT BE USED AS THE MATRIX MODEL BY THE READER FOR THE PURPOSES OF INVESTING.
In the above matrix, 15 of the 21 most commonly used ratios were used to evaluate the companies. At a minimum, any user of ratios should use no less than 12 ratios with at least one ratio from each of the five categories.
Throughout this site are individual articles written on the respective ratios and categories. I encourage the reader to learn more and read up on the various business ratios. ACT ON KNOWLEDGE.