
Deprecated: str_contains(): Passing null to parameter #1 ($haystack) of type string is deprecated in /home1/wanrru6iyyto/public_html/wp-includes/shortcodes.php on line 246
Railroad Companies – A Solid and Steady Investment
The railroad industry is divided into three distinct groups or ‘Classes’ per the Surface Transportation Board, an administrative affiliate of the Department of Transportation. They are as follows:
- Class I – Large North American railroads with revenues of more than $450 million per year and generally have activities across US borders;
- Class II – Regional railroads with revenues between $36 million and $450 million per year and tracks of at least 350 miles;
- Class III – Local railroads, including ‘Short Lines’; most Class III railroads are local government-owned agencies providing rail service to their citizens.
In general, Class III railroads are not publicly traded investments; they are privately held operations. Class II railroads mostly exist as private investments for equity groups or are part of a holding company. One of the largest holding companies for railroads is Genesee & Wyoming Inc., which owns over 100 regional and local railroads. Genesee is currently transitioning from a public corporation to a privately held investment. There are currently about a dozen publicly traded Class II railroad companies. Most of them are targets for holding companies as good investments for long-term cash flow.
Lastly, there are the big operations. There are seven Class I railroads, of which six are publicly traded. The seventh, BNSF, is solely owned by Berkshire Hathaway. The publicly traded Class I railroads are:
- Union Pacific
- CSX
- Canadian National
- Norfolk Southern
- Kansas City Southern (Merged with Canadian Pacific in late 2021)
- Canadian Pacific
These six are behemoths when it comes to railroad companies. All have revenues greater than $2.5 billion per year and hold at least $4 billion in fixed assets. The key to this investment is the asset allocation model. A common thread that binds all of them is that the asset side of the balance sheet is fixed assets-intensive. More than 85% of the assets are fixed in nature. The balance is comprised of receivables, cash, and some long-term amortizable rights.
Due to this asset structure, there are some business principles every investor should understand because they apply to railroad investments. First and foremost is the fixed asset maintenance/upgrade relationship with depreciation expense (allocation of utility value). The next principle is referred to as the break-even point. In general, long-life fixed asset-driven entities have lower financial break-even points than a traditional company. A third, and probably the most influential element of profit for a railroad company, is the concept of marginal dollars, adding a very high percentage of each marginal dollar of revenue to the profit. The following three sections explain these three principles in more detail, related to how they are applied to railroad financials. The final section ties it altogether for the investor as to why railroad investments are a solid and steady investment. Future articles related to this series utilize these three principles when discussing/explaining the respective investment.
Railroad Companies: Property, Investment, and Depreciation
In business, fixed assets generally have a low cost to maintain or have costs that can be deferred during lean times. A good example is real estate investments, they too are also fixed asset-intensive. If the economy slows, hotels, apartment complexes, etc., can delay upgrades or replacements of fixed assets. The same is true for railroad companies. If an investor reviews the cash flows statement of a railroad operation, they will discover value associated with upgrades and long-term maintenance changes in the investment section. With railroad companies, the most common investment ratio is at least two and a half times the depreciation charged during the recent year.
Depreciation is the tool to estimate the utility usage of fixed assets during the accounting period. In general, an investor will see between 3% and 5% of fixed asset cost valuations charged off to the income statement. In 2018, Canadian National recorded $1.3 billion* of depreciation on $37.8 billion* of fixed assets. That’s a mere 3.44% of the fixed assets value. At that rate, it will take 29 years to depreciate the existing balance of fixed assets. If you review Canadian National’s cash flows statement for 2018, you will find that they invested $3.5 billion* (a factor of 2.7 times depreciation) for additional property. In effect, net fixed assets increased from 2017 to 2018. Here is a snapshot of their fixed assets depreciation schedule and investments from the 2018 annual report. Go to page 75 to find the schedule.
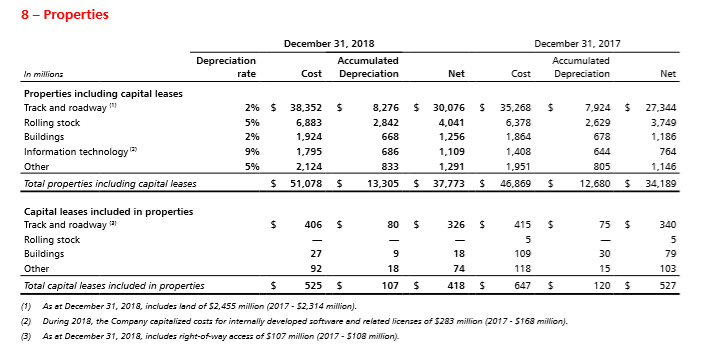
Take note of the following:
A) Track and Roadway is depreciated at 2% per year and is the most weighted portion of all fixed assets, thus strongly influencing the aggregated result negatively.
B) If you take the cost balances between the two years, track and roadway increased $3,084 Million* ($3.1 Billion*), and this is net of any disposal of property during 2018 (disposal refers to the sale of certain holdings).
C) Net fixed assets increased $3.6 billion* ($37.8 billion* in 2018 from $34.2 billion* in 2017) in one year.
The result is that, in general, Class I railroads have continuously growing fixed asset balances from year to year. This makes sense. First off, land is one cost that can not be depreciated under GAAP. Note 1 states that Canadian National owns land for $2.455 billion*. Another reason for the high cost is the natural entropy that exists with assets that are exposed to nature. Thus, nature’s impact requires constant upgrades, long-lived maintenance investments, and costly improvements to existing assets.
* All values are in Canadian Dollars; to convert to US Dollars, simply divide the value by 1.298 (the average exchange rate in 2018).
As an investor, you want to see investments into property that are at least 2.5 times the depreciation. The reasoning is simple. The costs on the balance sheet are often very old. The track laid 30 years ago for $1 million probably costs more than $6 million in today’s dollars to replace. Thus, investment in fixed assets must be high to maintain the overall integrity of the entire railroad system. Other assets, such as rolling stock (rail cars/locomotives), have shorter lives, thus a faster depreciation rate. Thus, a factor of 2.5 or higher is appropriate. As an investor, you want to understand this principle when reading financial reports. Lower ratios indicate a deferral of fixed asset values, resulting in false assumptions about the financial well-being of the company or its long-term thinking. It is not a good idea to forego future profits just to shift that value to the current accounting cycle. Good management of fixed assets is essential to the long-term health of a long-lived asset-based company.
Railroad Companies: Break Even Points for High-Cost Long-Lived Assets
The academic definition of a financial break-even point is when revenue equals fixed and variable costs to earn that revenue. The equation is straightforward:
Revenue = Fixed + Variable Costs
Please understand, there is a difference between financial break-even and cost accounting’s formula for break-even; these are two totally different concepts and formulas.
For most business operations, the fixed costs component of the equation is generally high. For example, with a typical retail outlet, fixed costs include rent, utilities, and minimal staff to run the store. Variable costs include the cost of the item sold, some packaging materials, and the cost of conducting the transaction. In effect, fixed costs will commonly exceed 25% of the revenue in the formula. Whereas with long-lived assets, it’s a significantly lower percentage. Yes, the actual fixed cost element for railroad investments is much greater in actual dollars than the retail outlet, but the revenue stream is easily acquired to cover the variable costs associated with that revenue, thus contributing cash to offset the fixed costs component in the formula.
In general, for railroad companies, the fixed cost component is indeed high, often several billion dollars per year. But most of the fixed cost component for railroads is the maintenance and depreciation of the fixed assets involved. Since depreciation is a low percentage value, see above, the average fixed costs component of the financial break-even point is lower as a percentage than in other operations. For example, using Canadian National, their fixed costs are approximately $2 billion to $2.5 billion (remember this is in a foreign currency). Using the upper range of this value, this is about 17.5% of revenue. Reviewing the financial income statement, I estimate marginal costs are about 53 percent of the dollar. In effect, the financial break-even point for Canadian National is around $5.2 billion. Since the pattern is similar among all the major railways, railroad companies reach their financial break-even point by the time summer comes around each year. The key is reaching the break-even point as soon as possible, as every additional dollar of revenue will add marginal profit to the company’s bottom line. In general, railroad companies have an advantage over other large companies due to their fixed asset-intensive operation, keeping fixed costs in line and relatively low as a percentage of revenue.
With this in mind, the third and most important business principle comes into play.
Marginal Dollars Add Disproportionately Greater Value to Profit
Now we get to the good stuff! Once those fixed costs are covered, each marginal dollar adds 47 cents to the bottom line. Why? The marginal costs are relatively stable at 53 cents on the dollar. Thus, in 2018, Canadian National needed the first $5.2 billion to cover the fixed costs and variable costs for that revenue. The remaining $9.1 billion in revenue contributed $4.27 billion to the profit. The actual profit was $4.3 billion; thus, my formula is close. Now imagine if they generated another $400 million in revenue during the year. The net profit would be $188 million higher, adding about 26 cents more per share of stock.
Any railroad company that invests in developing vertical integration in its business model will add marginal dollars to its revenue stream and, given the low financial break-even point, will be rewarded with increased profits per share. It’s how many large companies operate. Think of amusement parks; their fixed costs are set; each additional guest adds value to the bottom line. Thus, the reasoning why many park systems sell seasonal passes; they are trying to generate marginal dollars of revenue, adding at a faster rate to the bottom line.
When looking at railroad companies for investment purposes, read up on how they are doing to generate marginal dollars. It is commonly tied to vertical integration, creating synergy with its customers. For example, if you read the annual report for Canadian National, they are doing the following to create vertical integration and, in the long run, marginal dollars:
- Adding marine carrier services at their Prince Rupert port.
- Acquisition of Winnipeg-based TransX.
- Addition of grain elevators to capture more of the grain transportation market.
- Development of an alternative transportation option for bitumen.
By partnering with its customers, Canadian National is vertically integrating its operations, thus generating additional revenue in the future.
Railroad Investments – A Solid and Steady Investment
All the Class I Railway companies have more than 85% of their asset balances tied to fixed assets. The downside risk associated with losses is relatively low, as it is unlikely that fixed assets will suddenly decrease in relation to fair market value. Furthermore, the financial break-even point is lower for railroad companies than for other forms of investment. This allows a company to start generating profit earlier, and marginal dollars add quickly to the bottom line. All six publicly traded Class I Railways have the following positive attributes in common:
- All generate a profit, and the lowest net profit within the group is 22.8%;
- All have positive operational cash flow and good free cash flow;
- All issue dividends to their shareholders;
- All have gross profit margins > 34.5% with the average over 37%;
- All have low administrative overhead, generating high operational profit margins; AND
- All have similar 10-year growth lines related to share price.
When looking at the share price over 10 years, there are a few fluctuations (significant aberrations) over a short period of time with the price. The share price remains stable and continuously improving. Look at this graph of Union Pacific over 10 years as an example:
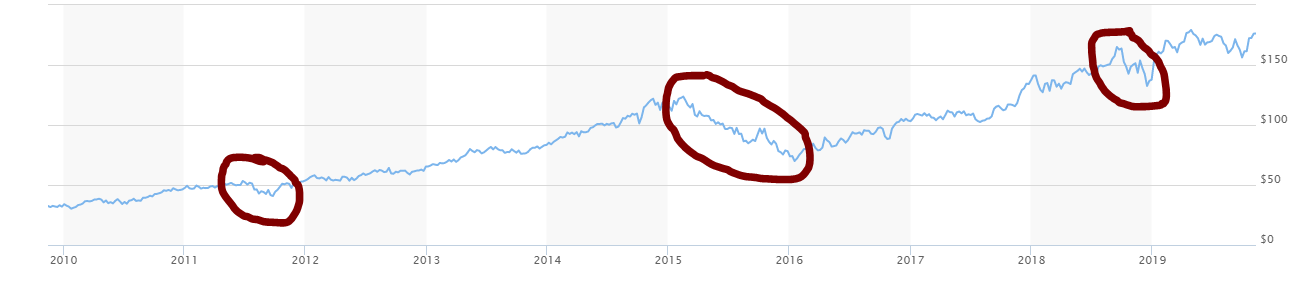
Something did happen from the 4th quarter of 2014 through the 3rd quarter of 2015, causing the share price to decrease steadily. But look at the long-term picture here; it is continuously improving. The key is that negative changes in price are uncommon and rarely significant (more than 3%).
This provides many opportunities for investors. For those with long-term goals (more than 5 years of holding), railroad companies are good investments. Those who wish to take advantage of opportunities to buy and sell, it is simply a matter of patience and waiting for significant share price changes and acting on those changes. The next article in this series will explore how to detect opportunities and act on them. It will also explore what the results are from acting on them.
This article was posted on 10/16/19. Interestingly enough, this calendar week has all of the railroad companies filing their respective Form 10-Qs with the Securities and Exchange Commission for the 3rd quarter of 2019. It will be interesting to read them later this week and see how all of them are doing. ACT ON KNOWLEDGE.