
Key Performance Indicators in the Railroad Industry
There are five Class 1 Railways traded in the US market. If you look at each railway’s respective annual and quarterly filings, all of them report certain key performance indicators (KPIs). Within the annual reports, the railway identifies the total number of revenue tons. In effect, this identifies the total volume of tonnage moved. With quarterly filings, the primary KPI is the number of rail cars moved during the period. In addition, they identify the volume of rail cars moved in a mix of various products. The key here is that each product moved has a different charge rate, thus certain products moved are more lucrative to the rail line over others.
A third KPI identifies the average speed of the rail line. The average reader wouldn’t think this is important, but in reality, it is a critical aspect of understanding the railroad’s performance. The higher the average speed, the lower the overall cost to transport the product, thus improving gross margins. This article introduces the reader to these various KPI’s and prioritizes KPI’s so an investor can discern the profit potential. The sections below cover the common terms used to measure productivity in this industry.
Key Performance Indicators – Revenue Ton Miles
In the transportation sector of the economy, the key to success is the ability to move weight for the least cost per mile of travel. The common weight measurement is tons. In the railway industry, the most important term used is ‘revenue ton miles’. The Bureau of Transportation defines this as the number of tons hauled one mile. Think of it as an average revenue per ton per mile of travel. It doesn’t indicate profitability because it clearly doesn’t express the cost per mile. However, the more tonnage, the more sales revenue generated by the railway company. For example, Canadian Pacific reports that during the week of November 9, 2019, the railroad company moved one ton of freight 3,138,000,000 miles (3.1 Billion Revenue Ton Miles). Naturally, they didn’t just move one ton of freight 3.1 billion miles. The Bureau of Transportation reports that the average Class I revenue per ton in 2018 equaled 4.23 cents per mile. Assuming Canadian Pacific charged 4.23 cents per ton mile, then Canadian Pacific’s revenue during this particular week equals $132,737,400. Let’s assume this is the normal volume per week; if we multiply this times 52 weeks, Canadian Pacific’s total revenue for 2019 would approximate $6.9 billion; coincidentally, Canadian Pacific’s actual revenue in 2019 was $6.0 billion. Doing some research reveals that Canadian Pacific’s actual revenue tonnage in 2019 was 154.4 billion tons (about 2.97 Billion Revenue Ton Miles/Week). Taking 154.4 billion times 4.23 cents per ton mile, we get about $6.5 billion of revenue. Thus, it appears Canadian Pacific charges slightly less per ton mile than the average for all Class I railways.
The key is this: knowing the tonnage per week provides insight as to the particular railroad’s revenue for the quarter. For example, during the last week of February 2020, Canadian Pacific transported 3.345 Billion Revenue Tons, which is significantly higher than the average weekly volume. Through the ninth week of 2020, Canadian Pacific is 8.8% ahead of 2019 through the same ninth week. This bodes very well for the first quarter’s revenue and indicates a positive sign. Let’s take a look at all six publicly traded railroad investments through the first 9 weeks and how they compare to their respective revenue tons at the same point in 2019.
. 2019 2020 Variance
Canadian Pacific 23,534M 25,611M 2,077M +8.8%
Union Pacific 77,347M 68,989M (8,358M) -10.8%
Canadian National 40,491M 39,396M (1,095M) -2.7%
Kansas City Southern Does Not Report Revenue Ton Miles in Weekly Metrics
Norfolk Southern Does Not Report Revenue Ton Miles in Weekly Metrics
CSX Does Not Report Revenue Ton Miles in Weekly Metrics
Because three of the railways do not report revenue ton miles, it makes it difficult to compare. However, as with all metrics, an investor should only compare production over time for each entity against its historical production. From the above, it is obvious that Canadian Pacific is performing well year to date. Its stock price from January 1 through February 29th follows this pattern:
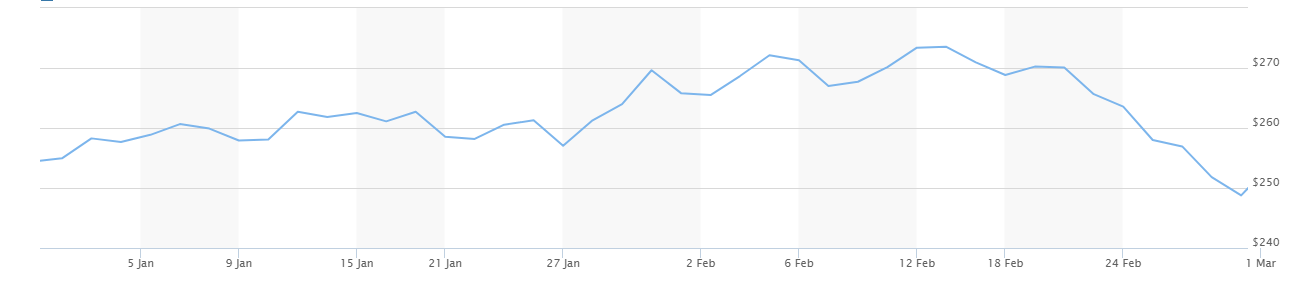
The share price drop starting around the 22nd of February is a direct reflection of the coronavirus scare and its impact on the market as a whole. However, the share price for other railways dropped a greater percentage than Canadian Pacific’s; most likely due to the high level of production Canadian Pacific reports.
For Canadian Pacific, their number one product moved is grain. This makes sense because the train company crisscrosses the heartland of Canada, the farm belt. If you review the number of cars moved just for grain during the week of November 9, 2019, Canadian Pacific moved 9,900 carloads of grain. Altogether, Canadian Pacific moved 790 million revenue tons of grain that week, about 25.17% of the weight moved that week. Grain hopper cars carry about 90 to 100 tons of grain per car. Assuming the average is 92 tons per car, then Canadian Pacific moved around 911,000 tons of grain that week. Since they are reporting 790 million revenue tons, this means the average grain hopper car traveled 867 miles. But there is another metric reported that tells you the exact number of cars used that week to move grain. It is the second most important metric used in this industry: Carloads.
Carloads
Unlike revenue ton miles, carloads merely state the volume of train cars moved during the period. Notice it doesn’t indicate the weight or volume of miles moved, just the number of carloads. There is a high correlation of revenue ton miles to carloads, but it isn’t pure. Thus, this key metric is a good one, but it comes in second place overall. By far, revenue ton miles is the best of all railroad metrics.
Through the 9th week of 2020, Canadian Pacific has moved 475,175 carloads. Whereas last year to date, Canadian Pacific had moved 441,078 carloads. This is a 7.7% increase in carloads. Notice that it doesn’t match purely with the 8.8% growth in revenue ton miles. It is close, but not perfect. Here are the results for the other railways:
. 2019 2020 Variance
Canadian National 979,256 920,901 (58,355) -5.9%
Union Pacific 1,491,477 1,351,828 (139,649) – 9%
Kansas City Southern 45,477 46,264 787 +1.7% (Merged with w/Canadian Pacific in 2021)
Norfolk Southern Use ‘Cars Online’ Metric *Note 1
CSX Use ‘Cars Online’ Metric *Note 1
*Note 1 – Cars online does not match carloads. Cars online are defined as cars available for usage, but not necessarily hauling actual cargo.
Through the first two major metrics, only four of the five railways report this information weekly. Norfolk Southern and CSX don’t follow the others. Thus, there must be some other tool to use for comparison purposes. There are other key performance indicators in the railroad industry. The next metric that is widely provided is the system’s average train speed. Let’s take a look and see how this metric is reported, and then evaluate the data and see if it can be used as a comparison tool.
Key Performance Indicators – Velocity
A third term that is also commonly stated is ‘velocity’. This refers to the overall average speed of the loads. How does this tie to the business principle of moving weight for the least cost per mile?
Velocity is an efficiency tool. The faster the railroad can move the weight to its destination, the more work the railroad can perform over the long haul. The faster the train can go, the there is greater the turnover of work. Think of this as comparable to inventory turnover with retail. Here are what the six major railroads are reporting as their velocity:
- Union Pacific 23.4 MPH
- Canadian Pacific 22.9 MPH
- CSX 21.2 MPH
- Canadian National 19.9 MPH
- Norfolk Southern 22.1 MPH
- Kansas City Southern 15.2 MPH (Merged with w/Canadian Pacific in 2021)
The novice investor will immediately exclaim that Union Pacific is the best because it averages 23.4 miles per hour. This is not necessarily true; each railroad company has different barriers to address when moving a trainload; some have to travel slower because of the high population density, which can slow the time down (think of Norfolk Southern operating along the East Coast). Others have to endure mountains and coordination related to timing, etc. Why have the velocity measurement if it can’t be compared? It can be compared, but only internally. The key is to monitor the railroad’s efficiency with its historical velocity. This is an example of Norfolk Southern’s average train speed over the last 14 weeks.
NS Train Speed 11-29-19 Thru 02-28-2020
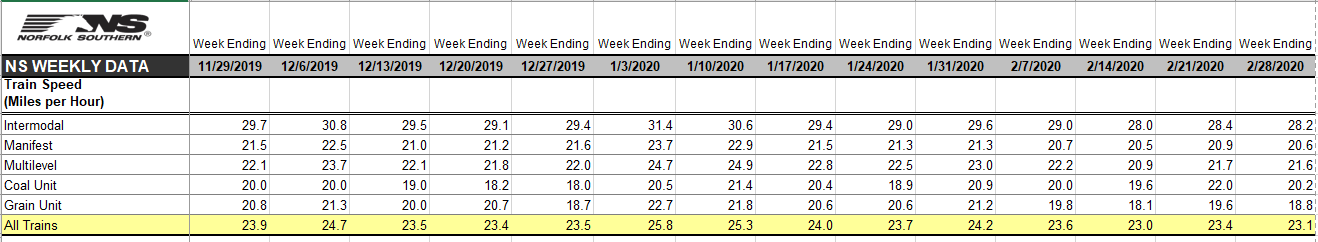
I reviewed the last five years, the best average high was 25.8MPH, and a low of 17.3. The dispersion range seems to be between 19 and 24 MPH. Grain Units are significantly less than the other groups of cars and weigh down the overall average. Thus, it appears difficult to use this particular metric as an indicator of value without additional data. For the period of time displayed above, it would be reasonable to assume the railroad is operating efficiently, as the lowest velocity is 23.0 MPH; therefore, costs must be efficiently controlled by the company. If the velocity were lower, costs would increase due to the additional time to move freight plus the additional cost of fuel involved. As stated in many of my articles, when I write about railroad operations, the costs of operations as a percentage of sales are the best gauge of performance. This particular metric substantiates the cost associated with operations, and I’ll compare velocity to costs in another article in the future as I develop trend lines.
There is still one more metric reported by all the railroads, and although the least valuable metric, it does have some value.
Key Performance Indicators – Dwell Time
When a train and its load pull into a terminal to offload, it takes time to turn the entire trainload over to the customer. The time spent at the terminal waiting is referred to as dwell time. Much of the terminal operations are handled by the railroad company and are not dependent on the customer or the customer’s agent to offload the product. In general, the two Canadian railways perform better than the U.S.-based railways. For example, Canadian Pacific’s dwell time last week was 5.7 hours per car; whereas, Union Pacific’s average dwell time per car was 23.8 hours.
The dwell time is not a significant contributor towards measuring productivity; it should only be an indicator of a problem if it increases dramatically and holds at the level for an extended period (like several weeks). Remember, there are variables beyond the railroad’s control that impact dwell time. Thus, don’t use this as a key performance indicator; it is more of a general performance indicator.
Summary
There are four key performance indicators. The first three are incrementally more valuable. Of the four, revenue ton miles is the most important as it identifies the actual volume moved during that period. Only three of the six publicly traded railroad stocks report this information weekly. The remaining three only report the total annual amount in the yearly financial report. Since sales are an instrumental value in evaluating a railroad company (costs of operations, variable costs, are easy to determine, and fixed costs are stable), it is a simple algorithm to determine profitability from those sales. Thus, revenue ton miles is the highest weighted value of all four key performance indicators. I believe revenue ton miles should be weighted more than 70% of all four key performance indicators.
Next, the number of carloads moved that week validates revenue ton miles due to the high correlation of the two metrics. Two of the five railroads (CSX and Norfolk Southern) do not report carloads; they use a variant called ‘Cars Online’ which includes all cars, whether they are sitting at a terminal or not being used at all. It isn’t the same as carloads. A third and important metric is velocity. Velocity is important, but only if the velocity trends poorly over a long period (more than 4 weeks). Other than that, velocity doesn’t impact the ability to forecast profitability due to the many variables involved.
The last metric is called dwell time. This one doesn’t assist in forecasting profitability either. It is an efficiency measurement, and I would only be concerned if it trends higher over very long periods (more than eight or nine weeks).
Overall, give a lot of credence to revenue ton miles, then carloads. The remaining two key performance indicators do not have a good correlation to profitability unless their results are poor over an extended period of time. ACT ON KNOWLEDGE.