Principle #1: Risk Reduction (Lesson 6)
It seems to be a law of nature, inflexible and inexorable, that those who will not risk cannot win. – John Paul Jones
Every day, each of us takes physical risks. The simple act of walking down a set of stairs carries the risk of slipping and injuring oneself. Other acts include driving a vehicle, working with tools, and cooking. Each of us minimizes the associated risks by taking precautions, behaving in a proper manner, and just using common sense. Furthermore, we mitigate the results by utilizing insurance to repair the damage from the accident.
Financial risk is different than physical risk. Unlike physical acts performed frequently, financial investments are seldom transacted. It isn’t like you are going to buy Coca-Cola stock daily. Thus, it is much more difficult to contemplate the best actions to reduce financial losses if the company goes south.
But with value investing, steps are taken to dramatically reduce potential financial losses. Risk associated with financial loss is addressed through three important practices. The first and best defense against losses is the type of stocks purchased. Only the best companies are considered for value investing. The first section below explains this in more detail and illustrates the different tiers of stock and why the lower tiers are ignored with value investing. The second best practice to reduce risk is a comprehensive understanding of the respective industry value investors trade. The second section below goes into an explanation of how knowledge of the industry is essential in reducing financial risk.
The final best practice to defend against losses is having a fundamental understanding of a company’s financial depth, the ability to withstand years of economic turmoil. The third section below introduces this mathematical algorithm for the reader. In addition, it introduces the first financial term of many that are used with value investing – book value. This term is used throughout value investing as a standard to compare other investments against, and of course, the ability of the particular investment to withstand long-term negative forces and quickly recover from any unusual events.
There are still many other practices and tools to reduce risk; they include understanding how operating cash flow must be positive, using business ratios to understand trends, and finally, using key performance indicators to assess productivity.
All of the above act as assurance that the respective financial investment is sound and will indeed perform well for the investor.
HOWEVER, with this stated, it is still important to reiterate to all investors that the risk of loss still exists. Many well-known companies have gone bankrupt, and so, it must be restated again: as an investor in the stock market, you understand that there is a possibility that you may lose your financial investment. Thus, it is important for you to only risk that which you can and do not rely on for financial security. In effect, ACT WISELY.
Risk Reduction – High Quality Stocks
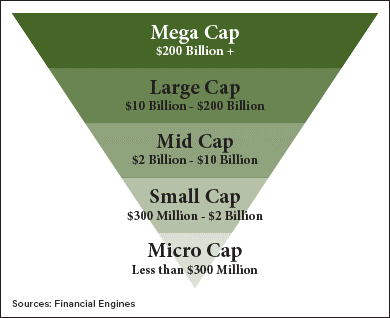
There are six tiers of stock available in the market. The lowest level tier is comprised of personally held companies. Many of these are your Mom and Pop operations, commonly referred to as small businesses. The more successful of these family operations can pursue to publicly sell their ownership rights by complying with the Securities and Exchange Commission rules and offer ownership via the market. This is where the next tier exists; it is called the Micro Caps and is traded on the Penny Stock Market, and the risk factor here is very high. Failure at this level is common, and for many of these companies, cash flow is a nightmare. Often, the operating cash flow is insufficient to contribute towards growth.
For those that do well, they can grow into a third tier commonly referred to as small-cap stocks. There are thousands of small capitalization companies traded throughout the world and on every exchange. Most of these companies have a limited product or service sold, or they may only service a small geographical territory. Almost every one of them is unknown to investors. Their financials are generally unreliable, and in addition, small-caps have inexperienced management teams running the company. A key identifier of this trouble is the stock’s price volatility. If you were to review the stock’s share price over a three-year window, it would look like a seismograph depiction of a volcanic eruption. The key here is that without consistency, small-cap stocks are risky investments.
A fourth tier is mid-caps. Similar to small-caps, Mids are generally larger companies with more financial backing and market presence. These are companies many of us have heard of or even possibly seen operate in our daily lives. Many of them have a large market share or operate in huge geographical markets. A common term used with mid-caps is ‘Growth Stocks’. This is because many of these companies are growing or have discovered something unique and are often in the news. For those of you new to the world of investing, you should immediately recognize that although many mid-caps are considered growth stocks, many are considered ‘Bearish Investments’. Understanding which trajectory the particular investment is on is difficult even for the most educated and well-read investors. This particular tier of stocks in the market is where the real ‘get rich quick’ stories happen, and of course, the stories we never hear whereby the investor ‘loses it all’. The key with mid-caps is that they are simply not large enough nor have enough history to rely on for investing. In effect, they are still risky investments, and the associated risk is too great to tolerate for value investors. Mid-caps are ignored for investment purposes.
It is the fifth tier of stocks where value investors look to buy and sell. The fifth tier of stocks is large capitalization companies. Large-cap stocks have a market capitalization greater than $10 billion, and they are considered very stable investments. Most of them consistently issue dividends and have excellent balance sheets, i.e., high equity position ratios. These companies hire the best for their management teams and seek out the top students from business schools to fill their management positions.
The top tier is, of course, the DOW Jones Industrial 30 companies.
Value investors create a pool of four to eight companies within the same industry. One of these companies will be from the DOW. That particular company is often the standard bearer for the pool. The other companies are compared against the standard related to their financial trends, performance reports, and intrinsic value. For example, if the industry is insurance, the standard bearer would most likely be Travelers Insurance, which is a blue chip company (DOW Jones Industrial Average). The other insurance companies would come from the fifth tier (large capitalization companies) of stocks.
Why do value investors only use large-cap and DOW companies for their potential investments? One answer covers it well – STABILITY OF EARNINGS. The most important element of evaluating any business is understanding that company’s ability to weather any storm. The longer the history of positive earnings, even during economic recessions, the higher the quality of the investment. In effect, large-caps and DOW companies have proven that they indeed are successful. There are some exceptions to the rule, but they are rare. For example, Tesla is still a young and unproven company. It has never paid dividends, and it only recently generated positive net income. Although Tesla is now in the S&P 500, it is not a highly stable operation. Value investors would ignore Tesla; this company has no stability of earnings, i.e., a real track record. Stability of earnings relates to years of positive earnings, at least 20 or more in a row. This means that the company has at least one industry-related economic cycle and a full market economic turn. Only companies with excellent products or services, along with good management, can achieve this kind of result. When a company can demonstrate stability of earnings, its risk of default or a sudden deep discount on its share price is simply nonexistent. Thus, the risk of losing money with this investment is effectively nil.
Utilizing a highly defined potential group of companies, DOW, and large-caps, for the buy-sell decision model goes a long way towards risk reduction. However, there are further steps the value investor can take to improve the quality of the investment pool. Learning about a particular one or two industries provides the needed confidence when evaluating and analyzing a particular company’s share price.
Risk Reduction – Industry Knowledge
Knowing one or two respective industries is essential for developing a decision model for your pool(s) of investment. Having a pool of similar companies from the same industry allows the value investor to easily compare and quantify buy and sell points for the respective members of the pool. It is critical to understand how the respective industry reacts to the economy as a whole, consumer demand, and legal compliance. All of these play a role in share prices.
Some industries are worldwide, while others only serve a limited market. Take utility companies, for example; many of them are restricted to a certain geographical zone. In effect, they are like a monopoly, and as such, growth is difficult as there is only so much demand for the respective utility in that zone. Whereas, the soft drinks industry continues to expand as third-world nations open their economies and the middle class grows in Asia.
Other aspects of industry knowledge include terminology, production systems, sales, and underlying costs of sales. Knowledge of the respective industry is customarily acquired by reading several resources. They include:
- Annual reports from the respective members in the pool of investments,
- Quarterly management presentations (often recordings of the management team’s presentation to institutional investors),
- Compliance regulations from the government,
- Economic and industry reports from the US Department of Commerce,
- Industry association or group research papers.
The key is to gain an understanding of the nuances that affect performance and ultimately financial results. Most value investors will acquire this knowledge for three or four industries and have three or four pools of investments for their entire investment portfolio.
Notice how risk reduction starts with a particular group of stocks, high-quality stocks. It then narrows more to just a few industries for the value investors. Now, the next step in this risk reduction process is to get selective about the respective members within each pool (industry).
Risk Reduction – Book Value
When selecting the respective member companies for the industry pool of investments, value investors seek out solid companies with deep reserves to prevent default. There are several different financial metrics or business ratios an investor can use to determine financial depth. But the easiest and fastest financial metric to determine this is book value.
Book value is, in effect, the equity section of the balance sheet divided by the number of shares outstanding (shares sold in the market). To illustrate, look at this simple balance sheet:
ABC Company Inc.
Balance Sheet
12/31/2020
(in $000’s)
Assets
Current $1,200,000 (because this in the term of 1,000; this equals $1.2 Billion)
Fixed 13,700,000
Other 600,000
Total Assets $15,500,000 ($15.5 Billion)
Liabilities $7,300,000
Equity 8,200,000
Total Liabilities & Equity $15,500,000 ($15.5 Billion)
Assume ABC Company has 385 million shares outstanding. To calculate the book value per share, divide equity by the number of shares outstanding. In this case, the book value equals $40.26 per share ($8.2 billion/385M Shares). Thus, whatever the current market price is, that is the amount a buyer pays to own $40.26 of value in this company. The difference between the book value and market price is the amount a buyer of stock is willing to pay for future dividends, increases in equity, and potential return on the investment.
Much of the current writings about value investing indicate that value investors seek out stocks that are at or below book value. This is not what value investing is about. Value investing is about buying low and selling high. It is true that as the market price decreases towards book value that there is an ever-increasing chance of greater reward when the stock bounces back to recent highs. But the real purpose of knowing the book value is understanding the most likely amount of the floor price in the market for the stock. With highly stable companies, the market price for a share will rarely, if ever, drop to book value.
It is extremely rare for the market price to dip below book value with high-quality stocks. If it does and the company meets all other criteria related to value investing, owning the stock can only be rewarding for the investor. Often, this is not the case. Some other outside force or reason will push the market price down for the company; thus, purchasing the stock will have risk.
The purpose of knowing the book value of potential investments is to understand when there is greater and greater pushback against a continuing price decline related to that stock. Don’t forget, institutional investors are continuously looking for good buys too. They will snap up the stock as its price declines towards that floor value (book value). The deeper the discount, the more buyers become interested in the respective stock. Look at this chart of Norfolk Southern Railroad over a recent twelve-month period. Norfolk Southern’s book value is $59 per share. There are two clear periods when the stock price goes lower. As the price continues downward, look at the volume of activity, which increases significantly. This happens in the March time period and October periods.
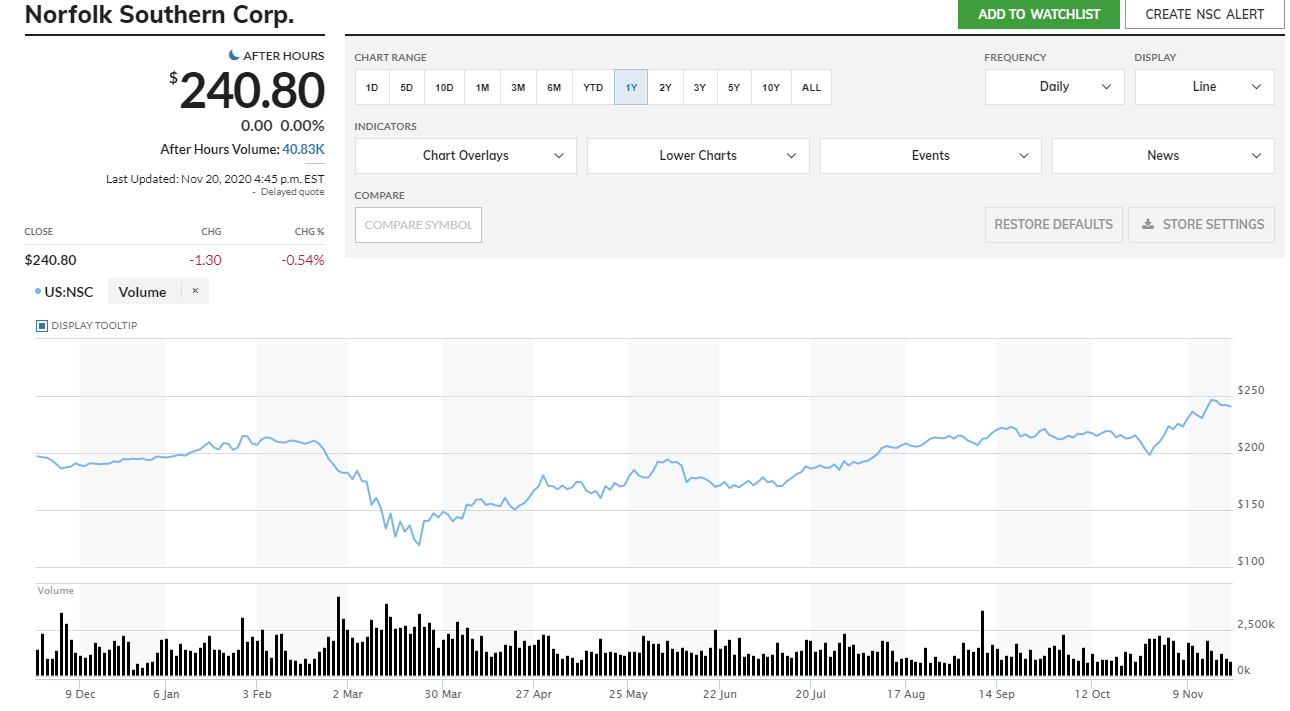
The volume of activity may be tied to sellers trying to dispose of the stock, but there is more activity as the price begins to head towards the book value of $59 per share. Norfolk Southern is a large-cap stock, a quality company with over 40 years of continuous positive earnings, even during the 2008 – 2011 recession. In addition, its cash flow is very good, and it has an excellent balance sheet and management team.
As a value investor, this type of chart is exactly what you seek out, as the price continues to decrease for the share, there is greater and greater interest and pushback against the continuing market price decline. This is the tool used to assess risk at the company level.
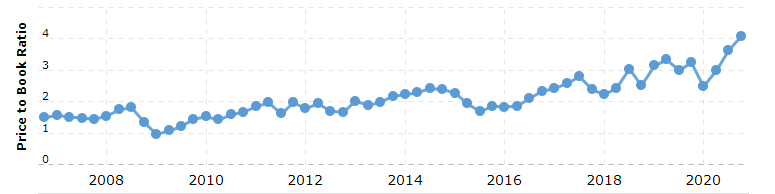
One of the trend lines reviewed for each member within the pool is the price-to-book ratio. Price to book is merely the ratio of the market price per share against the book price per share. Since both the numerator and denominator change continuously (the book price changes each quarter and right after a dividend authorization), the trend line identifies the floor price for a share. Here is Norfolk Southern’s price-to-book over the last 14 years.
Only once did the market price dip towards a 1:1 ratio, and this was back in 2009 during the long real estate market recession. In general, it rarely goes below 1.5:1; thus, at a book price of $59 per share, the floor is around $89 for this stock. That is why, up in the upper graph, the lowest the share price got in March was $113 per share. If you look at the trend line here, it is upward in its trajectory and clears a 2:1 ratio starting in 2017, and it doesn’t look like it will go below a 2:1 ratio shortly.
This tells a value investor that the worst-case scenario for a floor price for Norfolk Southern is in the neighborhood of $118 per share (2X the book value of $59/share). Again, as the price drops, there is more activity with the stock driven by institutional players and interested buyers acquiring positions in this stock.
When addressing risk at the company level, the book value is used as the baseline for determining the floor price for the stock’s market price. The price to book trend line augments this information and assists the value investor with knowledge about the most likely bottom price. This doesn’t mean that this bottom price is the buy price for the stock. For quality stocks to go this low, some economic force of great strength must push them down. The COVID pandemic is a good example of a strong economic force causing a great price dip in stocks.
In Lesson 5, it was explained how different forces act on the market price of stock. These fluctuations occur, and when they do, value investors are there waiting to pounce. In Phase Two of this program, there is a set of lessons that explain, illustrate, and demonstrate how to calculate the buy and sell prices for the respective companies in the pool of investments. The series of lessons in this section of Phase One explains all four principles involved.
In Phase Three of this program, the member is introduced to the Railways Pool, which includes Norfolk Southern. It turns out Norfolk Southern’s formula generated the bulk of the gain earned by the program’s Investment Fund in 2020. In mid-October of 2020, the formula triggered a buy with $20,000; 13 days later, the stock price recovered to the sell point of 103% of the prior peak price, and the stock was sold, earning $2,771. This equates to a 27.7% absolute return after fees. The key that makes this return so high is that it was done in 13 days. Now these earnings are available to invest in a new opportunity. Act on Knowledge.