
Real Estate Investment Trusts – Analysis and Evaluation Techniques
Real Estate Investment Trusts (REITs) are considered excellent long-term investments. There are two underlying reasons. First, under the Internal Revenue Code, they are considered income tax-free investments. To comply, the REIT must distribute at least 90% of all net income earned to shareholders. The shareholders pay income tax on those dividends received. Because of the dividend distribution requirement, REITs have excellent dividend yields. This is why REITs are considered perfect investments for widow and orphan funds, whereby cash is necessary to fund the monthly payments to annuitants. Secondly, similar to any real estate investment, time is beneficial to the overall value of the REIT’s fixed assets. No differently than owning a home, time allows the underlying asset to increase in value. Thus, the normal pattern for a REIT’s market price should be a slow and continuous positive increase over time. Long-term resale of the stock should provide capital gains for the investor. Putting the two financial benefits together creates an excellent long-term return on one’s investment in the stock.
With value investing, the concept is to own quality stocks at good prices. This matches the primary tenet of business – ‘Buy Low, Sell High’. When the price returns to normal, proceed to sell the stock and continue the pattern. The long-term outcome is significantly greater returns than many of the common market indicators (DOW Jones Industrial Average, S&P 500, Russell 2000, etc.).
REITs are generally high-quality investments. Their financial statements are moderately difficult to read due to two uncommon financial measurement indicators of 1) funds from operations (FFO) and 2) normalized funds from operations. However, with an understanding of basic accounting reporting information and how FFO is quantified, a reader of REIT financial reports can quickly ascertain the overall performance of the entity.
Analyzing and evaluating REITs is similar to owning residential property as a landlord. However, the scale is exponentially greater, practically eliminating variances. In effect, there is improved predictability and reliance on the information provided. With REITs, investors look for three key financial indicators of performance. First, is the dividend yield percentage. This matches the landlord’s desire for cash flow from their investment in real estate. Secondly, holders of rental property desire positive net income in order to assure adequate proceeds to make the principal payments on any mortgages associated with the property. Finally, landlords want to ensure that their rent charges mirror the economic conditions of the property’s location. With publicly traded REITs, this is evaluated with the fixed assets turnover ratio.
The following sections cover the three basic principle indicators of value and describe evaluation techniques for each. The overall goal is to identify long-term trends of each indicator and weigh them appropriately for a general sense of REIT performance. Using this information, a value investor can then easily identify opportunities, set buy/sell trigger points, and take action. The result is outstanding returns well over the various market yields.
Real Estate Investment Trusts – Dividend Yield
The formula for dividend yield is simply the dividends on an annual basis divided by the price an investor pays for the stock. With a simple example, dividend yield is illustrated. Suppose Equity Residential Trust pays $2.65 per share annually, and an investor purchases the stock for $60 per share. The result is:
= Dividends
. Price Paid for a Share of Stock
= $2.65
. $60.00
= 4.416% Yield
The key for any investor is to understand that this is never static. It changes every day. The market price continuously fluctuates, and typically dividends change on an annual basis. However, with REITs, there is some consistency. In general, rents rise on an annual basis. Therefore, cash flow normally improves from year to year, ultimately, net income increases from year to year, and the end result due to the Internal Revenue Code’s requirement for REITs is that dividends customarily increase from year to year. Here are three examples of the continuously improving dividend payouts for REITs over the last ten years:
YEAR EQUITY RESIDENTIAL ESSEX TRUST UDR, INC.
2011 $1.35 $4.13 $.72
2012 1.58 4.40 .77
2013 1.97 4.84 .88
2014 2.15 5.20 1.01
2015 2.16 5.76 1.09
2016 2.06 6.40 1.16
2017 2.03 7.00 1.22
2018 2.13 7.44 1.28
2019 2.24 7.80 1.37
2020 2.38 8.31 1.44
The result is simple to understand: an investor’s yield consistently improves from year to year since the market price paid is set at purchase. A REIT shareholder should expect their yield to almost double every ten years.
Value investors do not seek out high-yield dividend stocks; however, if the opportunity presents itself to acquire high-yield stocks at a low price, why not take advantage of what the market will provide? As an example, on October 28th, 2020, Essex Property Trust had shares selling at $186.32. Current dividend payout indicates $8.31 per share. This means, Essex’s yield for any shareholder buying at that moment is 4.46% annually. This shareholder should expect that the yield to exceed 7% in ten years, possibly 9%. Think about that for a moment; an investor earning more than 5% yield on their investment is superior under current market conditions (4th quarter 2020).
The bottom line is straightforward: an investor in Real Estate Investment Trusts should expect excellent yields for their respective investment. This is driven by the tax code and the business environment of rental real estate. The earnings are continuously and consistently improving.
Recall basic financial principles: dividends are driven by earnings; that is, net income. This leads into the second of three financial performance indicators – positive net income.
Real Estate Investment Trusts – Net Income
The number one financial metric identifying success is profit. Every company must strive for profit. Without profit, long-term viability is questioned. There are times when profit is not expected, such as economic depressions, catastrophic events (earthquakes, weather conditions, or other acts of God), or sudden environmental changes. Of course, during 2020, COVID has created such a situation, whereby profit is not expected by consumer-based business entities. However, what is expected and considered minimal for any business operation is to cover the fixed costs of operation.
Value investors tend to shy away from business operations that have large swings with sales tied to abnormal changes in conditions. Many industries in the market shield themselves from economic depressions, catastrophic events, and environmental changes. Typically, these industries are tied to the required human needs. Examples include food, housing, medical care, and transportation. REITs fall within the sphere of housing, and as such, it is expected that tenants to pay rents. However, during this unprecedented COVID pandemic, Congress has allowed deferrals of rents for certain situations. Thus, there is some impact on the revenues of REITs, but in general, this reduced revenue condition is temporary and should only reduce net income for REITs slightly. Well-managed REITs will minimize the impact of reduced revenues tied to COVID, or for that matter, any of the three market conditions identified in the prior paragraph. Simply put, REITs will rarely, if ever, have net losses associated with rental income. It doesn’t mean it will never happen; REITs may lose money due to the sale of poor or underperforming properties that eliminate or greatly reduce the net income from normal operations.
For the reader’s understanding, REITs primarily earn money from rents. A typical REIT will own more than 100 properties. Each property will have more than one unit available for rent. Thus, an apartment complex-based REIT may own 300 different complexes, with more than 20,000 units available for rent in the aggregate. However, REITs often dispose of a few properties (complexes) each year. This income stream is often reported as a single figure net of costs. In most cases, it is reported as a gain, i.e., the sales price is in excess of the costs of the sale. Thus, net income is increased by the gains from the sale of properties. Therefore, to understand how much profit is earned from rents, an investor adjusts the actual net income for the gains made from the sale of properties. Look at the example below, this is the summary report for the fiscal year 2016 through 2019 and for the first three quarters of 2020 for UDR, Inc. (United Dominion Realty).
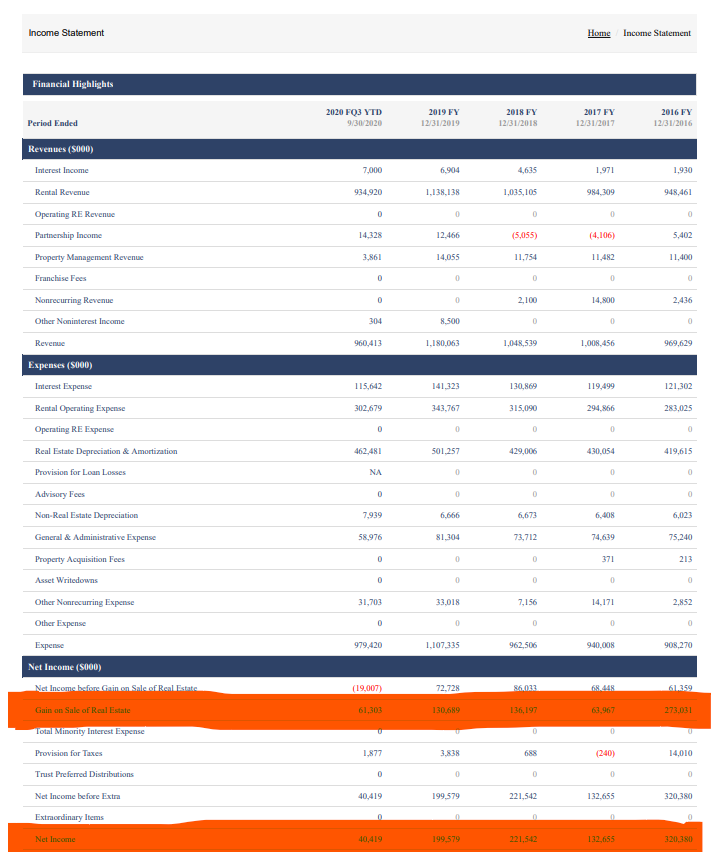
Take note of the following:
A) In the final section of this report, Gain on the Sale of Real Estate is highlighted in orange. Every year, UDR sells properties and reports this income in a separate line. In their case, it is reported after the net income associated with rental property income is reported.
B) Notice how in the YTD 2020 column, UDR has generated a ‘LOSS’ from traditional rental operations. However, when adding in the gain from the sale of properties, UDR generates a positive net income. Look at the last line of the report.
C) Most REITs do not report the gain in a separate section after calculating net income from rental operations. It is customarily included in the revenue section and, therefore, a reader of financial statements must make the adjusted calculation separately to determine if traditional rental operations are generating net profits.
D) As an additional side note to UDR’s information for YTD 2020. For purposes of cash income (not cash flow from operations, which is calculated differently), simply add back non-cash expenses. In this case, add back both real estate depreciation/amortization and non-real estate depreciation to determine cash income from rental operations. The result is a positive cash income of $451,413,000 (the reported values are in thousands of dollars; thus, the loss from regular operations is $19 million).
An investor in UDR would want to know why UDR has lost money year to date in 2020. Reviewing the financial report for the 3rd quarter ending September 30, 2020, reveals that UDR has three significant contributing factors for the loss associated with regular operations:
- Depreciation per revenue dollar increased from 42.26% to 49.26%; in the aggregate, in comparison to the first three quarters of 2019, depreciation increased $105 million. There is no underlying supporting schedule to substantiate this significant increase in the costs of operations.
- Overall average rental income decreased 4.7% between the two similar periods tied to the same units available for rent.
- Interest expense covering the same 9-month period increased $30 million. There is no supporting schedule.
Typically, detailed supporting schedules tied to items 1 and 3 are provided in the annual report. It is the author’s opinion that COVID contributed approximately $40 million of the loss and that the increase for depreciation is a reflection of newly acquired properties during 2019 and YTD 2020. In effect, the delta from 2019 and the first nine months of 2020 is a direct reflection of a decrease in rents received, an increase in depreciation per rental dollar, and the additional interest expense.
Other REITs did not perform as poorly as UDR did this year to date. However, going back to the primary aspect of this part of REITs’ performance, net income is expected even during difficult economic conditions. If there are losses, it is important to understand the driving forces for the respective loss from recurring operations, i.e., renting of property.
As a value investor, when a loss such as that documented by UDR does occur, it may drive the stock price significantly lower, often beyond the expected outcome; the loss generated would impact the value of the stock. When this happens, the opportunity to buy stock in a REIT materializes. Remember what value investing is all about – ‘Buy Low, Sell High’. One of the key indicators of opportunity when losses like this are reported is the fixed assets turnover ratio.
Real Estate Investment Trusts – Fixed Assets Turnover
The fixed assets turnover ratio is designed to evaluate performance from fixed assets. Service or mixed-based industries have little or no reliance on this business ratio. However, high fixed asset-based businesses such as real estate, transportation, and communications rely on this measurement metric to determine financial performance. With real estate, it is a simple formula. Take the rents received over one year and divide by the cost of real estate. Do not use net costs of real estate (depreciation-adjusted value); use the original purchase basis as the denominator.
As an example, from above, UDR earned $1.138 billion in rents during 2019. UDR’s investment in real estate was $12.7 billion during 2019. This means, UDR’s fixed assets turnover rate was almost 9%.
With REITs, desirable fixed asset turnover rates exceed 9.8%. Anything from 9.3 to 9.8% is considered acceptable. Any value lower than 9.3% requires additional research to understand the driving force of the lower value. The most common business driver of lower turnover rates is market rents. If rents do not mirror market rates, then the fixed assets turnover rate will deviate from reasonable expectations.
Other drivers of lower rates include recent purchases of real estate, which weigh the total fixed assets investment on the balance sheet higher. Those REITs with older properties tend to have higher ratios. If the portfolio of properties is normal, then lower rents are negatively affecting the fixed assets turnover rate.
For 2020, the impact on rents due to COVID and the COVID-related economic downturn is lowering the fixed assets turnover rate for all REITs. The key to this ratio is to make sure the outcomes over some time stay within preset limits. If the formula outcome stays within the established boundaries and the stock price decreases dramatically, value investors need to act and buy the stock. Once rents return to normal, the financial performance will drive the stock price higher.
One last important note tied to this ratio and REITs. It is extremely critical to look at the REIT’s historical trend related to this ratio. A minimum of six years of trend is required. From this trend line, the ratio boundaries are then calculated. If a REIT’s fixed assets turnover rate decreases and the stock price does not, the stock is overvalued. Pay close attention to this business ratio with REITs.
Real Estate Investment Trusts – Setting the Buy/Sell Trigger Points
The perfect stock for value investors is high fixed asset-based companies with stock price volatility of 15% or more in cycles of less than 6 months. These are hard to find. REITs do not fit this model. Why? REITs rarely have volatility swings of more than 10%. REITs are steady revenue/cost relationship operations. They consistently make profits. They are dividend-driven investments and appeal to investors interested in yield and not gains.
However, this doesn’t mean a value investor should ignore them. The key is to monitor the stock price in comparison to their financial performance. If the stock price drops more than 20% and the financials do not indicate serious issues, then owning the stock is validated. It will take time for the stock price to return to normal, and of course, this is one of the tenets of value investing: maintaining patience. The problem is that the cycle time is typically longer than what is desired with value investment stocks. Thus, deep price discounts are needed to warrant the time investment.
Thus, with REITs, look for price discounts from prior highs of more than 20%. The stock price should recover to its original high within 18 months. This is the time to sell the stock. Thus, buy points are 20% or more discounted from prior peaks, and sell points are at prior peaks or higher.
Immediately, many of you will notice that this doesn’t generate 30% or more return on one’s investment. It does. Why? During this extended cycle time, the REIT is paying dividends.
Here is an illustration:
In June of 2019, Avalon Bay’s stock price peaked at $199.10. A 20% decrease existed in the first week of February 2018. The value investor then makes a buy at $159.28. The stock recovers to its prior peak in early March 2019 (13 months later). At this point, the value investor sells the stock for $199.10 and makes a gain of $39.82. During this time frame, the investor records receipt of four dividend payments totaling $6.08. Total earnings equal $45.90 on an investment of $159.28 or a 28.82% return over 13 months. When adjusted to 12 months, the return on the investment is 26.5%.
The author encourages greater than 22% discounts from prior peaks and sells points of 102% of the prior peak. This buy-low sell sell-high formula for REITs will earn the investor more than 25% annual returns on their investment. If recovery periods are accelerated, the return on the investment increases at exponential rates. The risk factor is relatively low, and during the holding period, dividend yields often exceed 3.5%.
An excellent tool to use is the price-to-book ratio for high fixed asset-based investments. The price-to-book ratio acts as a bellwether of value for these types of investments. Act on Knowledge.