
Key Performance Indicators (Lesson 11)
“If it cannot be measured, it cannot be managed” – Peter Drucker.
All of us use indicators every day to help us manage our lives. These indicators assist us in making good decisions. This same concept exists with stock investments. There are several different indicators related to stock. Most of them are financial and often summed up via business ratios. However, many of the top companies provide additional indicators. One of these additional groups of indicators is ‘key performance’ markers. In effect, they are production-based bits of information that assist value investors in developing and validating a good buy/sell model for that particular company.
Performance indicators are different for each industry. For the value investor, understanding the respective industry along with its systems, processes, and critical points is essential when evaluating the current stock price along with market reactions. It is important for the value investor to understand not only the quantitative results of performance, but also the standard of performance to measure the actual outcome against. In most cases, performance indicators exist for sales, production, and marketing/advertising. The key to success is to incorporate all these different data points and create an impact factor upon the company’s stock price.
The first section below explains how each industry is different and the thought process value investors must use to assess the respective members of that pool of investments. It is best to identify the top three key performance indicators and their respective impact on the overall financial performance of the company. Once you understand the industry’s respective critical points, value investors can then develop the standard of performance. Often, the standard of performance is provided by the company in its annual report. There are other resources for each industry; one of the best resources is the Department of Commerce for U.S.-based operations. With a standard to work with, quantitative results can then be compared against this standard, and often, a trend line is necessary to grasp whether the respective company is doing well or having problems. The third section below breaks down key performance indicators into the respective major areas of the financial statements. By understanding the overall industry and the respective lower-level indicators, a value investor can easily assess corporate performance. Finally, it is important to tie it altogether and determine a simple ‘Yes’ or ‘No’ to a company’s overall performance. By understanding these key performance indicators, how to obtain the information, and interpret the results, a value investor can have greater confidence in their buy/sell model.
Industry Level Key Performance Indicators
There are three economic wide indicators commonly followed by all investors – gross domestic product, the inflation rate, and the unemployment rate. These indicators give a sense of the overall picture. The same concept exists at the industry level. The only difference is that at this level, the indicators are strictly industry-related and have some connection to the economic-wide indicators, but mostly, industry-level indicators merely paint a picture of that industry only.
Be careful when reviewing industry-level indicators; less sophisticated users of data believe that sector-level indicators are indicative of the respective industry within that sector. This is not the case. The economy is divided into approximately eight sectors:
- Financial
- Utilities
- Manufacturing
- Wholesale Trade
- Retail
- Transportation
- Information
- Other
Each sector has its respective set of industries. For example, transportation is divided into:
- Air
- Ocean Going
- Railroads
- Trucking
- Private
- Seaports
- Terminals
- Express
- Logistics (Fleet Management/Warehousing/Handling)
The point is that a value investor can’t compare the performance standards of one industry against another. They use different models, and there are certain business principles more equitable to some than others. As an example, economies of scale are more critical to ocean-going shipping than to express shipping. Express shipping is keyed to delivery times, ocean-going is about volume, at the least cost per unit of measurement. Thus, value investors need to ask themselves pertinent questions about each industry. Always be thinking – ‘What makes this industry go?’. For example, with the railroad industry (one of the Pools of companies the Value Investment Fund uses with the membership club), the key performance indicator is revenue ton miles. What is the cost per revenue ton-mile to ship the goods? How many revenue tons were shipped during the respective financial period? How much is charged on average per revenue ton?
In some industries, what makes them go may be market share (restaurant chains, pharmacies, and equipment rental) or occupancy rates (think hotels, resorts, and REITs).
The best sources of industry-related performance standards are found on the federal government websites, especially in highly regulated industries such as banking, utilities, and pharmaceuticals. During Phase Two of this program, there are a couple of lessons that illustrate this very process of research related to the development of a pool of similar investments.
Key Performance Indicators – Setting the Standard for Value Investing
Once a value investor identifies the top three industry performance standards, the value investor must then set the standard. In effect, the value investor must find the best company within that pool of similar companies. How do you find this standard? The most likely outcome will be from the leader of that industry.
Every industry has a leader, a company that dominates over others. Typically, they are easy to spot; in some industries, there are possibly two, and they compete with each other. To figure out the leader, simply create a table tied to two valuation ratios. Valuation ratios are how the market perceives the respective company.
The two valuation ratios to review are the price to book value and the price to earnings. In general, the price-to-book ratio is a longer-term valuation ratio (it is a balance sheet-based ratio), whereas the price-to-earnings (income statement-driven ratio) is merely a reflection of value tied to the most current year of earnings. To illustrate, the following is an example of a table tied to the Investment Fund’s Railways Pool. The market price is as of today, 12/23/2020.
Name Book Value 12 Months Trailing Earnings Market Price Price to Book Price to Earnings
Union Pacific $25.41 $7.85 $202 7.9 25.7
Canadian Pacific 43.95 12.54 341 7.75 27.2
Kansas City Southern 47.35 6.04 203 4.3 33.6
Canadian National 27.19 3.56 110 4.0 30.9
CSX 16.64 3.60 90 5.4 25.0
Norfolk Southern 58.82 7.76 232 3.94 29.9
Historically, Union Pacific has been the benchmark company to use. There are several reasons: 1) it has the longest history of existence; 2) the company is the largest railway with a market capitalization of $137 billion, almost twice the value of the closest market capitalization for a railroad; 3) the company has weathered many economic recessions and still generated profit during those recessions. Look at its price to book; only Canadian Pacific comes close, the others are significantly less. Canadian Pacific has shown continuous improvement over the last few years.
As stated above, the price to book is a longer view valuation ratio, whereas the price to earnings reflects the trailing twelve months. Thus, the price-to-book ratio is given the greatest weight when determining the standard of performance to use in buy/sell models. It is the author’s opinion at this point to continue to use Union Pacific, but the author believes Canadian Pacific will overtake Union Pacific within a few years due to multiple reasons. This information is discussed in more detail in the members’ section of this website within the Railways’ Pool of investments.
If there is some anxiety about future earnings, the price-to-earnings ratio will reflect this perceived depression with earnings. Currently, all the railroads are financially performing less than their historical earnings due to the reduced revenues tied directly to COVID. What is truly fascinating is that their respective market prices are at or near all-time highs, even with reduced revenues. As an example, Norfolk Southern’s revenue for the first nine months of 2020 is $1.4 billion less than in 2019, yet its stock price is trading well above its peak pre-COVID price. How can this be true? It’s simple: the above six companies are all Class I railways, and all of them have demonstrated highly stable historical earnings, the number one factor that impacts market pricing.
Without a doubt, Union Pacific continues to lead this industry; Canadian Pacific is catching up, and they may well take over in a few years. But for now, Union Pacific is the standard against which all other rail lines are compared.
Thus, the next step is to identify the top three performance standards with which to measure success. How does one identify the key performance indicators within the respective industry? The answer is simple: read that company’s annual financial report to identify what management identifies as critical performance metrics. Another alternative is to go to the company’s website and click on the investors tab, and look at their performance metrics.
On page 31 of Union Pacific’s SEC filing for 2019, management does indeed identify the key performance indicators for their company. Here is a copy of that section of their report to investors:
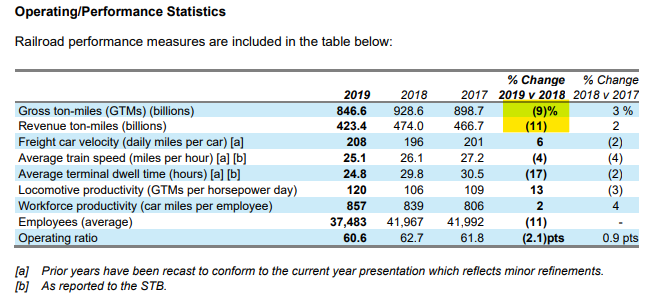
In Union Pacific’s case, two of its top three clearly show negative performance in comparison to the prior year of 2018. More importantly, the number three KPI doesn’t have anything to do with earning revenue; it is really more of a cost control tool. In effect, Union Pacific hauled a lot less in 2019 than in 2018, significantly impacting sales.
If you were to read the other five company reports, you would also see how they, too, focus on revenue ton-miles, train speed, and dwell time. Take note of the last line of data.
If you have been reading the lessons in successive order, you should have already gathered that one of the key financial performance indicators is the operating ratio. This is the cost per dollar of sales. In this case, Union Pacific’s cost per dollar of revenue decreased 2.1 points (3.3%). It is directly tied to gross profit margin and is explained in detail as one of the top five key financial points every value investor must know for all their stock selections; see Lessons 8 and 10.
For those of you interested in railways as an investment pool, this site’s Value Investment Club utilizes this pool of information in its fund groups. To access the details, you must be a member of this site’s Value Investment Club.
Now with the key performance indicators set, the next section explains how to quantify information and tie it to financial results.
Quantification of Key Performance Metrics
Quantifying information is merely a three-step process. First, gather the data; next, compile the data; and finally, organize the information in a coherent presentation format. Most folks will utilize spreadsheets to compile and organize the data. The actual source information is found at the respective company’s website. Once the spreadsheet is built, it is a simple step to update it once a quarter or annually, depending on the nature of the respective data metric.
For those of you who are currently not members of the Investment Club, the club’s pools of investments have their respective spreadsheets that are updated by the facilitator, and information is disseminated to members regularly to reinforce or modify the respective buy/sell models for each company. During Phase Two of the program, members are taught via several different lessons how to build their spreadsheets for their particular pool of investments. The respective spreadsheets are turned into the club for review by the facilitator and members; questions and concerns are raised to the spreadsheet’s author in order to confirm its validity. With each successive update, the spreadsheet’s results are included in that Pool’s database for access by other members.
For this lesson, the author will continue by illustrating how revenue ton miles are evaluated in the railway industry. Again, the key is to find the standard and use that to compare against the other investments of the respective pool.
Since the standard bearer is Union Pacific, the first step is to pull the volume of revenue ton miles per quarter. The goal is to understand the impact of revenue ton miles on sales.
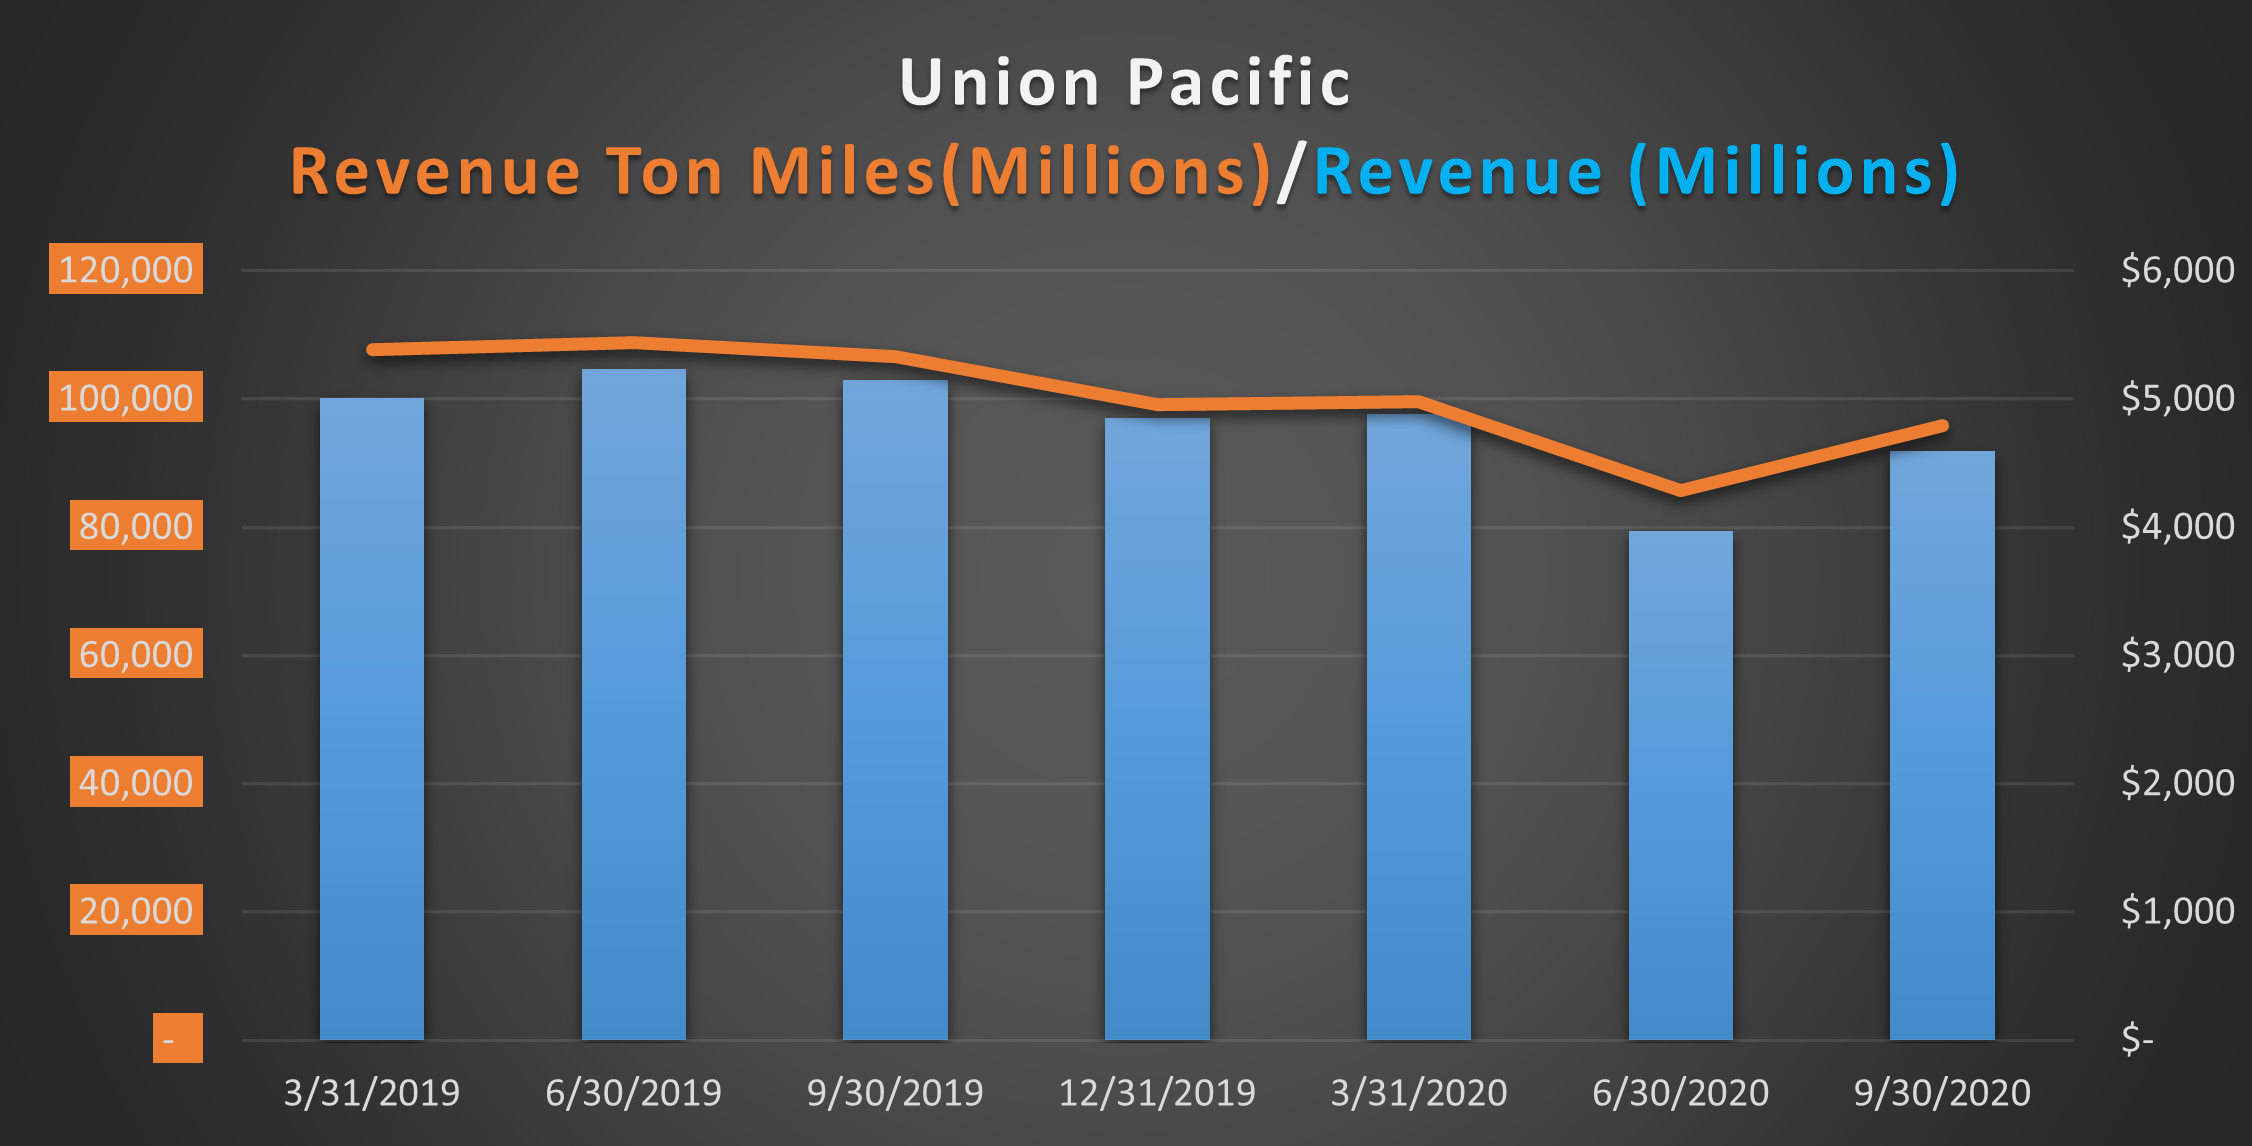
The orange highlights the tonnage moved during each quarter. Naturally, revenue correlates directly to revenue tons moved. Thus, at the end of the third quarter of 2020, Union Pacific moved 97 billion tons and earned $4.8 billion.
For the fourth quarter of 2020, through December 26, total revenue tons moved equal 99.7 billion tons, with one week to go. Thus, it appears that Union Pacific’s revenue for the 4th quarter of 2020 will exceed $5 billion. If you were to graph this on this chart, the trajectory is continuing upward. Thus, once the financials are reported in mid-February, odds are that the stock price will not decrease in value; it is expected that the fourth quarter financial results will be good.
The interesting aspect of this is that each Monday, Union Pacific reports its performance results, i.e., the revenue tons moved, carloads, and travel velocity on its website. Institutional investors are keyed into this and monitor this data as it is released. Thus, Union’s stock price should show some improvement*, at worst, stagnant changes in value. But it is unlikely the price will drop dramatically.
*As of this writing, at 4 PM, Union’s stock price improved $2.25 per share; this is a 1.1% improvement. This validates that company-level performance has some immediate impact on the price, but unless there is some form of an extraordinary event, it is unlikely the share price will deviate dramatically (< or > 5%) from its current market price.
This same concept is applied against the other members of the respective investment pool, value investors use to buy and sell stock in a particular industry. The key is to track the trend line over an extended period of time. If there are no significant changes in the interim period, then it is highly unlikely that the stock price will experience a price reduction due to industry and company-level performance. In effect, all members of the pool of investments should display similar results with their operations. Slight deviations are acceptable, but a significant (> 3%) change in any direction calls for review and monitoring of that stock’s respective market price, as there will be some impact on the market price. Remember, economic-wide issues have the greatest impact on stock prices; review Lesson 3 about market fluctuations. This means that any significant change of more than 3% at the industry or company level will indeed affect the stock price for the respective company or industry.
Furthermore, this tracking is done for all of the top three key performance indicators for each pool. In most cases, these three performance indicators are reported quarterly. It just so happens that the railway industry reports its respective information weekly. This is due to the volume of rail cars moved and the technology used to compile data.
Key Performance Metrics Conversion to Financial Results
Converting performance metrics is similar to how small business owners review their production and the anticipated impact on the financial results. The key is to increase sales and reduce the direct costs of sales, creating greater profit margins. At the upper end of corporate operations, it is the same. Key performance indicators should tie to sales and cost of sales reduction, creating better gross profit margins and ultimately absolute dollars to the bottom line.
In the railway industry, tonnage moved equates to sales, as illustrated above. The other performance metric used that is tied to sales is the number of carloads moved during the interim periods. As for the cost of sales, the Railways Pool utilizes two important performance metrics.
Think of the two key costs to move tonnage. The first is fuel consumption and the corresponding cost per gallon for diesel. The second big cost is labor.
The key metrics that directly connect to these two cost elements are a function of efficient operations of the rail cars. Thus, freight car velocity (how far a car travels per day) and train velocity (how fast the train travels per hour) are a reflection of both fuel costs and labor costs. The further a freight car travels each day, the more efficient the labor costs to move tonnage. Train speed affects fuel consumption, but typically, the cost per gallon is beyond the control of the company.
Just as with the tracking of revenue ton miles above, both freight car velocity and train speed are tracked and compared against the overall costs of operation for the respective members of the Railways Pool. Any significant deviation from expected results will impact the market price per share. In the long run, this also impacts the buy/sell model as minor adjustments are necessary to the company’s buy/sell model to achieve maximum return on an investment.
One of the drawbacks to the above is, of course, the reporting periods of both bits of information. In the railway industry, the key performance indicators are in the form of non-dollar amounts reported weekly. Financial results are reported quarterly. Thus, it is difficult to have a pure correlation between the two values. Therefore, value investors have to monitor other sources in addition to what is reported by each company. For example, with railways, a value investor may also monitor the cost of fuel, and if there is a sudden increase, the associated costs will be reflected in the quarterly financial results when they are reported at the end of the current period. Fortunately, railways, as with all large transportation industries, assess a fuel surcharge to offset sudden fuel price surges. This doesn’t take away from the importance of monitoring fuel prices as supplementary information.
Join the Value Investment Club
This site's Value Investment Club (Membership Required) utilizes a Value Investment Fund model with an annualized 23.3% return over a SIX and THREE QUARTER-YEAR history. It has grown from a starting basis of $100,000 and is now $411,989 before taxes of $91,166. This is a 19% annualized return after taxes.
Membership provides instantaneous access to time-sensitive information.

Membership provides:
- Email Alerts for any pending transactions or actual activity for this site's Value Investment Fund; members may want to mimic the transaction activity for their personal investment fund.
- Monthly Newsletter regarding the activity within the Value Investment Fund;
- Quarterly Spreadsheets for each active pool of investments with this facilitator's calculated intrinsic value, buy and sell points;
- Weekly Article regarding one of the 60-plus potential investments outlining the respective business dynamics, issues, standards, and calculated buy/sell matrices;
- Watch Notices for possible opportunities along with suggested buy and stop loss points.
Value investing, in its simplest terms, means buying securities at a low price and selling them at a higher market value. Value investing is defined as a systematic process of purchasing high-quality stocks at an undervalued market price, quantified by intrinsic value and justified through financial analysis, then selling the stock promptly upon market price recovery. Membership gives the reader full access to all information on this website. Act on Knowledge.
Key Performance Indicators – Corporate Performance
The end goal of monitoring key performance indicators is to validate the ongoing performance of the company’s operations. This validation process prevents ‘surprises’ and boosts confidence in the buy/sell model developed. For many value investors, it takes about 10 to 20 minutes per week, depending on the number of pools of investments the respective investor utilizes. For most investors, it is a function of the quarterly updates when the respective companies report their financial and performance results via the SEC 10-Q report.
The end goal of monitoring performance is to determine if the buy/sell model requires any updates. It is a simple ‘Yes’ or ‘No’ decision. When creating a trend line of data, it is best to look at as much history as possible; the author suggests no less than five years; preferably, the trend line should be greater than seven years. Analytical standards place more emphasis on recent results in comparison to historical outcomes. Value investors take a more conservative approach and use the average of the trend line to determine the ‘Yes’ or ‘No’ model update. The reasoning is simple: short-term results or near-term expectations should have little bearing on overall historical performance and the corresponding buy and sell triggers for a particular stock. Just because the recent performance is either elevated or depressed doesn’t indicate an ongoing trend. Recent performance may have been hampered or enhanced due to environmental or unusual conditions. Basing one’s decision on the most recent results is speculative and not a sound investment concept. Using the overall average is superior as it eliminates speculation. Act on Knowledge.