
Dividends and Earnings Analysis – Railroad Stocks
Mehmet Murat ildan. “If a railroad is bent, the train shall turn over; if a man’s character is bent, he shall turn over just like that train” –
Dividends and earnings analysis is one of the core requirements of calculating intrinsic value via security analysis. There is a relationship between dividends and earnings; one is a function of the balance sheet, the other is tied directly to the financial performance of the company as reported on the income statement. In general, there must be earnings in order to pay dividends. Investors, especially those holding common stock, want rewards for their investment and often are short-sighted when it comes to receiving dividends. Earnings reflect the power of the company to generate value for the investor. With value investing, the key tenet is to buy a security at as low a price as allowed by the market and then sell this security at the highest price. In the interim, dividends serve as compensation for a value investor’s patience while waiting for the market price for the security to recover to a reasonable high price.
Railroad stocks are unique. This is one of the few industries where all the players have a very similar revenue and cost of production business matrix. There are exactly five publicly traded Class I Railways in North America. All of them have to play by the exact same set of legal compliance requirements; utilize the same physical and technological systems; and cooperate with each other to transport goods across the continent. Interestingly, all five have similar financial characteristics:
- All generate a profit, the lowest net profit within the group is 22.8%;
- All have positive operational cash flow and good free cash flow;
- All issue dividends to their shareholders;
- All have gross profit margins > 34.5% with the average over 37%;
- All have low administrative overhead, generating high operational profit margins; AND
- All have similar 10-year growth lines related to share price.
One of the metrics that separates them from one another is their dividends and earnings relationship. Performing a dividends and earnings analysis gives a slight advantage to the value investor over traditional traders and, in some cases, if the analysis is done properly and timely, a distinct advantage over professional traders. This particular article is in-depth and educates the investor about this aspect of security analysis for this one industry. The opening section introduces the relationship between dividends and earnings with business in general. Certain key principles bind these two financial items together. Understanding this interrelation is key to application of determining the value of a company. With this understanding, the second section below develops the railway industry as a whole. It looks back over the last ten years of actual dividends and earnings for all six railroads and analyzes their trends. Here, the impact of this relationship and how it affects the stock market price for the industry as a whole is evaluated.
The final section explores each company individually and explains how this dividend and earnings analysis impacts each company’s respective intrinsic value. The goal is to assist with determining reasonable relationships to the actual stock market price for the company’s shares. The result is a security analysis for each railroad stock as it relates to the dividends and earnings.
Understanding the relationship between dividends and earnings is essential as one of the value investment metrics used by value investors when determining intrinsic value, along with expected market highs and lows for a particular stock.
Dividends and Earnings Analysis – Financial Relationship
Purpose of Earnings
If you read Johnson & Johnson’s credo, it identifies three distinct goals of the company. First, it states that the patients, doctors, and nurses are the company’s primary responsibility. Secondly, the credo speaks to employee security. Finally, the credo states that it is the goal of the company to make a profit, but it goes further:
Our final responsibility is to our stockholders. Business must make a sound profit. We must experiment with new ideas. Research must be carried on, innovative programs developed, investments made for the future, and mistakes paid for. New equipment must be purchased, new facilities provided, and new products launched. Reserves must be created to provide for adverse times. When we operate according to these principles, the stockholders should realize a fair return.
Notice how Johnson & Johnson’s credo explains how the profits are to be used. There must be investments made for the future and to pay for mistakes. Furthermore, tangible fixed assets must be acquired to fulfill the need to innovate and conduct research.
The key here is that profit is necessary to fulfill four aspects of good business: 1) reward shareholders, 2) invest for the future, 3) purchase fixed assets to produce new products, and 4) set aside some money for ‘adverse times’.
* Side Note
Johnson & Johnson’s credo was written in 1943 by Robert Wood Johnson, one of the founding family members of the company. Notice how something written 80 years ago is still applicable today.
All companies must make a profit to provide a reward to the shareholders for their risk, invest for the future, and improve the overall financial condition of the company. These are the basic principles of earnings application. They are considered the central purpose of profit. Just as with many business judgments, what is the allocation model for earnings that best serves the company?
Dividend Policy
There are many different guides advocated by sophisticated professionals. Some are extreme and only endorse pure return to the shareholders via dividends or full retention to expand the organization. There is no correct model. The best allocation framework is highly dependent on the company’s respective position in its life cycle and its short and long-term goals. Many young, growing small-cap companies rarely issue dividends in order to retain earnings to fuel growth. Mature companies often have high percentages of dividend payouts as a ratio of earnings, as their market share has boundaries, and investment for the future has only marginal returns. Thus, there is no universal earnings allocation model that best serves all parties. There is no correct answer.
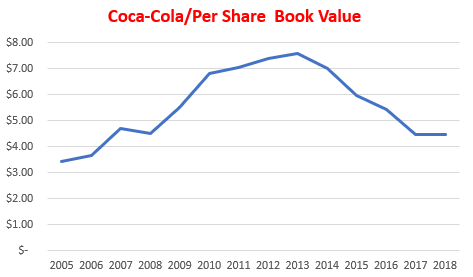
A good example is Coca-Cola, one of the best stocks to own. Historically, Coke pays out a high percentage of its earnings as dividends. It only retains a small percentage of earnings to improve the company’s financial position. In 2020, Coke paid out almost 91% of its earnings as dividends. It has a very high debt-to-equity ratio of 3:1. Yet, this company continues to reward shareholders over other aspects of earnings allocation. Coke is a member of the DOW Jones. It is one of the top 30 companies in the world.
At the other extreme sits Disney, another DOW Jones company. On average, Disney pays out less than 25 cents on the earnings dollar. Disney’s balance sheet is impressive, with a 1.30:1 debt-to-equity ratio, and 17% of its assets are current assets. 17% current assets percentage for a long-term product-based company is very strong.

Disney uses discretion to pay out dividends. The company’s mindset is to control debt with its earnings and maintain its portfolio of assets (parks, cruise ships, intangibles). Thus, the book value continuously improves over time.
Both companies utilize a dividends policy that works well for them. With Coke, they have a very focused balance sheet, $87 billion of assets with almost $20 billion of this as current assets (cash, receivables, and inventory). Coke’s 2020 net earnings were $7.7 billion; thus, if there is an economic collapse, they could easily utilize current earnings to absorb economic fluctuations.
Whereas with Disney, their entire asset structure ($200 billion) is centered around long-term value derived from entertainment rights and family-themed resort parks. Having a strong balance sheet protects them during recessions and a short-term depression. Here, an economic recession instantly impacts the income statement; thus, Disney must have a strong balance sheet to deal with adverse times (reread J&J’s Credo).
As an investor, you must understand the dividend policy and its impact on earnings. Some industries require strong balance sheets to endure economic hardship; others, not an essential requirement. The market, however, is not this sophisticated in understanding this relationship.
Financial Relationship
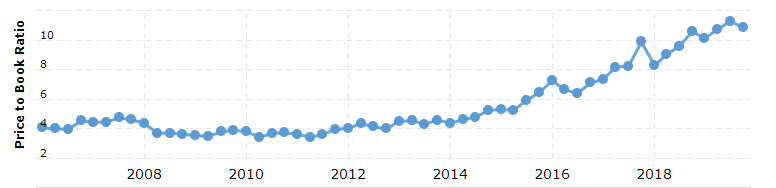
This dividend earnings relationship impacts the decisions of investors. Professional investors are aware of this dynamic relationship between the two financial terms. Many of these professionals will not break it down to an industry-level relationship; they focus on the relationship as if it were a market-wide dynamic. They will use ratios such as price to earnings per share or dividend yield to compare against other potential investments. A sophisticated investor understands that you can’t possibly compare Coke and Disney. Yet the market does. Look at their reported dividend yields, price to earnings, and price to book as of 02/24/2021:
Name Dividend Yield Price to Earnings Price to Book
Coca-Cola 3.31% 29.65:1 4.40
Disney .89% No Recent Earnings 3.96 (rarely exceeds 3:1)
Averages in the Mid-Teens
Both are high-quality companies, members of the DOW Jones, and provide products consumers desire. Both have a minimum of 80 years of experience and rarely lose money (Coke has never recorded a loss).
For comparison purposes, go back to late October of 2019 when Disney reported its year-end earnings for 2019 and Coke reported its third quarter of 2019 earnings. Using Coke’s trailing twelve months of earnings as the comparison, look at the stock prices in the market for both companies:
Trailing Twelve Market Price Share Price
Name Month Earnings Per Share 10/25/2019 Per $100 Million of Earnings
Coke $8,497 Million $55 $0.65
Disney $11,054 Million $130 $1.18
Notice the distinct value the market places on two similar, powerful companies. One pretty much pays out all of its dividends to its shareholders, the other is more conservative and takes a prudent approach to dividends to ensure the long-term well-being of the organization. Both are behaving appropriately, yet the market is willing to pay more per share for Disney due to the strong book value per share. In return, the average price-to-earnings ratio is significantly higher for Disney, even though the company is acting in an appropriate manner.
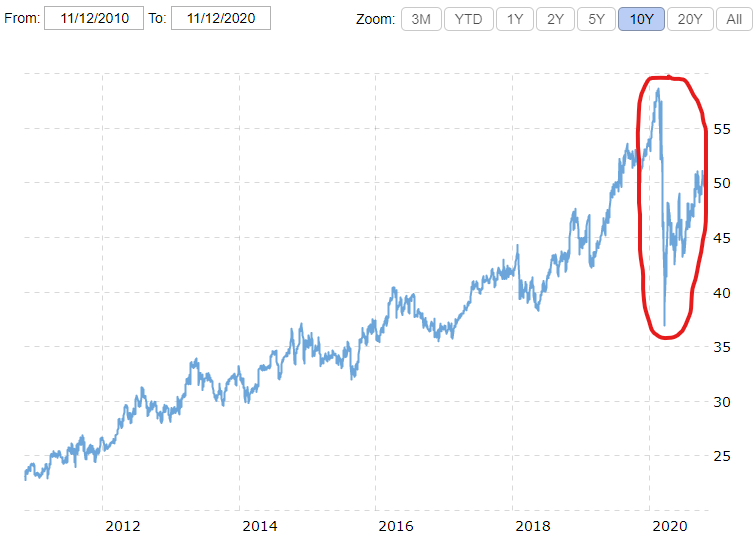
What this means is that at the end of the day, those companies with strong dividend payouts are less risky to investors. Investors will reframe from bidding up high-dividend-ratio investments. This tells us that some investors are in it for dividends and not share price gains over time. For value investors, it is about buying low and selling high. In general, those companies with strong dividend ratios compared to earnings will most likely have fewer opportunities to buy low and sell high, as many investors give more credence to dividends over earnings related to determining value. This dividend approach tends to keep certain high-quality companies’ stock prices stable, thus providing limited, if any, opportunities to own these types of high dividend payout operations. Only when their market prices take dramatic downward price swings (more than 30%) in a short period of time (less than one week) should value investors even give consideration to purchasing securities with these companies. For example, only twice in the last 15 years has Coke’s stock price dropped by more than 30% in a short period of time. Once was during the economic recession of 2009, and the other in February/Early March 2020 during the COVID market panic.
When investing in a certain industry, understand the respective dividends and earnings relationship for the industry as a whole. Review dividend policies for each member of your pool of similar investments. This provides perspective on this relationship so you can compare and contrast the existing potential investments and adjust your intrinsic value and corresponding buy and sell points for the security.
With this core understanding of the relationship between dividends and earnings, let’s now turn to understanding the dividends and earnings relationship in the Railways industry.
Dividends and Earnings Analysis – Railroad Stocks
As stated at the beginning of this article, railroad stocks provide a unique opportunity for value investors. It is one of the few industries where the performance and financial dynamics are so closely aligned among all participants. All of them have good gross profit margins and very little overhead as a percentage of their revenue. Their asset sides of the balance sheet are similar to. The following table illustrates this well.
. Union Pacific, Canadian National CSX Norfolk Southern Canadian Pacific Kansas City Southern
Current Assets 6.7% 6.9% 11.2% 6.1% 5.6% 7.4%
Fixed Assets 89.4% 90.4% 81.5% 82.6% 86.4% 91.6%
Other Assets 3.7% 2.7% 7.3% 11.3% 8.0% 1.0%
Liabilities 72.8% 56.1% 67.1% 61.0% 69.0% 51.5%
Equity 27.2% 43.9% 32.9% 39.0% 31.0% 48.5%
Notice how the asset ratios are somewhat similar to each other. Railroads are simply fixed assets-intensive. Fixed assets include land, track, ballast, facilities, locomotives, and cars. Railroads qualify as high fixed asset ratio operations. What is different is how these assets are financed. Of the six, the smallest railroad has the most conservative bottom half of the balance sheet. With an equity position of 48.5%, it is a key sign that their dividend payout ratio is going to be conservative. Kansas City Southern’s approach is to use earnings to maintain an excellent balance sheet. Very few companies have a 1.06:1 debt-to-equity ratio. This means that of all the railroads, Kansas City Southern is in the best position to use the balance sheet to weather economic downturns or quickly expand assets by borrowing money.
At the other end of the balance sheet layout is Union Pacific. Unlike Kansas City Southern, it is more reliant on debt to capitalize the assets on the balance sheet. Thus, it is highly likely that Union Pacific’s dividend policy is to reward investors over retention of earnings to reduce debt as a percentage of assets.
To validate this relationship, take a look at this table of dividends to earnings ratios for each company over the last ten years.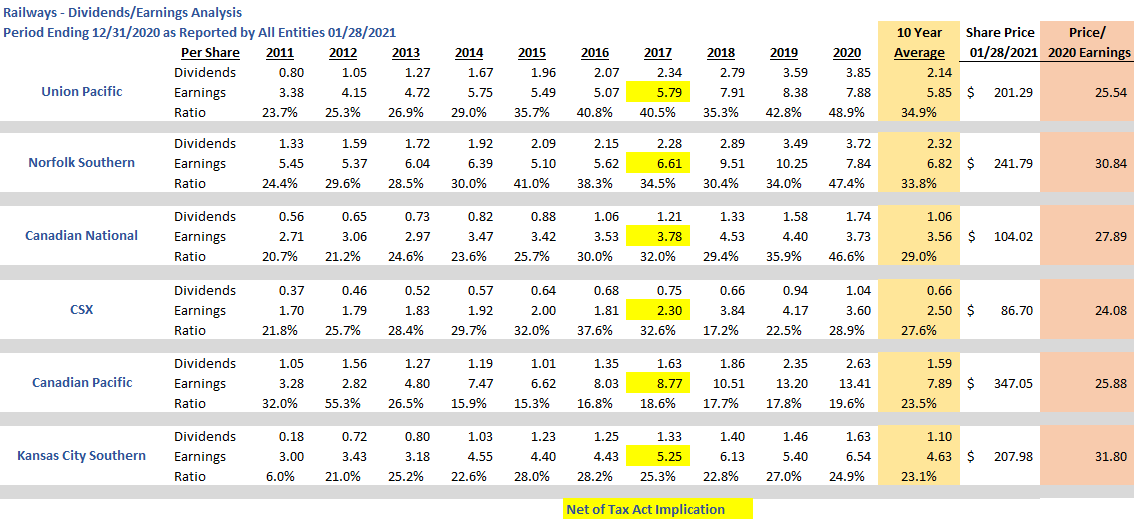
The above ratio payouts validate the corresponding balance sheet results. Notice that Union Pacific pays out almost 35% of its earnings on average, the highest amongst the group. In turn, its balance sheet emphasizes debt over equity to finance assets. At the other end is Kansas City Southern, which only pays out 23% of earnings as dividends and uses the retained amount to reduce debt or improve its debt ratio. Simply put, Kansas City Southern is in the best balance sheet position as a railway.
The relationship may not appear pure here because the balance sheet is a reflection of a lifetime of activity, whereas the dividends/earnings payout ratio only reflects the last ten years. If the pattern were to include the lifetime of dividends to earnings ratio, it would almost be a perfect match for every single entity. Don’t forget, entities can simply borrow more money to add more assets, which in turn changes the debt-to-equity ratio. However, most companies follow industry standards, and each must comply with similar debt restrictions, terms, and compliance factors.
Why is this relationship so important to understand?
Go back to the basic principle of risk in business. One of the tools to shift risk is to shift capitalization of assets to lenders, commonly referred to as leverage. As a traditional investor, it is more desirable to have a high dividend payout ratio to get as much reward for your investment as soon as possible. Value investors are different from traditional investors in that value investors seek out investments with dramatic swings between market price lows and highs in as short a period of time as possible.
With traditional investing, if something were to go wrong several years out from now, like a total collapse of the company, who bears the risk in a high-debt-based operation? Now, with railroads, this is so unlikely, there would have to be either hiring of total imbeciles to manage and run the company or a total collapse of the economy, almost at the level of a civil war. Transportation of goods across the continent is a requirement to meet the needs of all citizens. Thus, it is so unlikely for any of the companies to perform with losses. Interestingly, over the last 15 years, through two recessions, at no time have any of the six railroads reported any losses in any quarter of reporting financial results. In effect, there is very little risk of any one of the above six railroads losing money. Thus, financing assets with some debt leverage is not unreasonable given the circumstances. Given this, investors would indeed desire stronger dividend payouts and would be willing to bid up the stock price to acquire such stocks. Yet the dividend yields don’t indicate this. Look at the average dividend yields (using the last three years of dividends) for all six railroads:
Name Avg./YR 3 Yrs of Dividends Market Price Yield
Union Pacific $3.41 $201 1.7%
Norfolk Southern $3.36 $242 1.4%
Canadian National $1.55 $104 1.5%
CSX $.88 $87 1.0%
Canadian Pacific $2.28 $347 .66%
Kansas City Southern $1.50 $208 .72% *Kansas City merged with Canadian Pacific in late 2021.
Union Pacific has the highest yield of the five railways. This appears counterintuitive to the general market tendency. Furthermore, on 01/28/2021, it had the second-lowest price-to-earnings (P/E) ratio. On this date, Union Pacific was the best buy dollar for dollar of all five railways. It doesn’t mean that a value investor should purchase; it merely means that when evaluating railways based on dividends and earnings, and of course, risk reduction, Union Pacific was the best selection among the six companies. On 01/28/2021, all six companies were way above intrinsic value, and as a value investor, none of the stocks is appropriate as a value investment.
This same analysis is performed when any single member of the group’s stock price drops below intrinsic value. It is essential to monitor the entire group, and if a particular potential investment’s stock price provides some margin of safety and it falls within the top half of the dividends and earnings analysis, it is a signal to purchase the stock. The value investor will see a high dividend yield, a low P/E ratio (most likely in the mid-teens or lower teens), and a higher current (recent three years of activity) dividends payout to earnings ratio. These financial metrics ensure compliance with the four core principles of value investing: 1) risk reduction, 2) purchase with a good margin of safety below intrinsic value, 3) financial performance exists to validate a good market recovery price, and finally, patience to wait for market price recovery.
This industry tends to have all five companies move in unison around intrinsic value. Now and then, the industry falls out of favor with institutional investors because the railways industry may have one or maybe two bad quarters in a row, but it is simply uncommon for this industry to swing low for an extended period. Railroad stocks are solid investments. Be patient, historical market analysis indicates that there are typically one to two swings in market price per year.
Impact of Dividends and Earnings Analysis Upon Intrinsic Value for Each Railroad
There is no single intrinsic value formula. Benjamin Graham and David Dodd did create a core model, but if you read their book, Security Analysis, it advocates a practical approach at the industry level. They write about several different intrinsic value formulas using both balance sheet and income statement approaches. They give greater reliance to balance sheet items, especially current assets, over long-term assets. However, they wrote their theories, approaches, formulas, and concepts tied to the first half of the 20th century. Accounting and compliance have eliminated many of the nuances they explain exist with financial information. Modern-day investors place too much emphasis on earnings and less credence on the balance sheet or the dividends to earnings relationship.
With railways, they have one particular asset that is not posted to the balance sheet. This is the going concern element of business. There is no current existing idea to replace the transportation of the three trillion tons of goods that crisscross this continent. Railroads are the absolute leader in cost per revenue ton miles to transport goods. There is no other transportation method that comes close. Railroads are here to stay for the foreseeable future, at least 25 years. Thus, their respective going concern is an asset of real value. It is the primary asset when evaluating railroad stock.
When calculating intrinsic value for each railroad company, its dividends to earnings relationship within the hierarchy of the industry can change the intrinsic value outcome up to five percent in either direction around the intrinsic value. As an example, Union Pacific’s current intrinsic value is $170 (2020 value). However, because Union Pacific holds the number one position for dividend payout as a ratio of earnings, a value investor can add five percent to the intrinsic value and feel comfortable with a $178 intrinsic value point. Even with an extended recovery period, an investor will receive $4 in dividends over one year while waiting for market recovery. This is due to the strong dividend payout ratio. Furthermore, this company is still in a strong fixed assets position. Why? This company has been around much longer than the other railways. Some of its fixed assets were recorded at very old prices; think of the land grant value Union Pacific recorded back in 1869; yes, you read that correctly, 1869. In effect, the net realizable fair market value of the underlying fixed assets is higher than the recorded book value due to the maturity of this company.
The following sub-sections cover each of the remaining five railroads and how to modify or adapt the dividends to earnings analysis to their respective intrinsic values.
Kansas City Southern (Purchased by Canadian Pacific)
As cited above, Kansas City Southern is at the opposite end of the dividends to earnings analysis and the impact on intrinsic value. Kansas City Southern has a strong balance sheet, especially with financing the fixed assets. With almost an equal debt-to-equity funding, Kansas City Southern can easily purchase more fixed assets by borrowing additional money. This strong balance sheet mix has provided a lot of security to investors. The current PE ratio is a very high 31, which is really high for just about any publicly traded company.
Kansas City Southern’s intrinsic value is currently estimated at $140 per share (2021 Value). There is no upward addition because the dividends to earnings payout ratio is below 30%. This low dividend payout hurts intrinsic value. Kansas City’s average dividend payout is a meager 23%. This does not help to facilitate a fast recovery during market recovery for stocks like Kansas City. In order to get a good return with a stock like this, a value investor must buy the stock with a greater margin of safety and wait an additional two to four percent longer to reach reasonable market recovery prices. For example, right after the COVID market decline in early March 2020, Union Pacific’s market price recovery happened in 80 days; whereas, Kansas City Southern’s share price took an extra 7 days, nearly 10% longer to recover.
Value investors desire two elements in the return on investment formula: the first is, of course, the difference in price between the buy and the sell points. The second is time; the longer it takes, the lower the overall effective return.
Thus, with a lower dividend payout percentage, it will take longer to recover to a reasonable market sell price. This means that in order to get a good return on the investment, the value investor must buy at a lower price. Given the additional time factor in the formula, a value investor must subtract 3% from the intrinsic value based on the impact of dividends on the earnings relationship. Thus, the adjusted intrinsic value is approximately $136 per share (2021 Value) for Kansas City Southern.
Norfolk Southern Railroad
Norfolk Southern Railroad is halfway between Union Pacific and Kansas City Southern as it relates to the financing of assets. With a 39% equity position and a strong dividends to earnings payout ratio, there will be a positive effect on intrinsic value for these high dividend payouts. Norfolk Southern almost mirrors Union Pacific with a 34% 10-year running dividend payout percentage. This helps accelerate market recovery after a decline in security pricing.
Review of the assets layout identifies a strong percentage of its assets classified as other. Norfolk Southern has the majority position with Conrail, Inc., which is a shared services area with CSX railroad. Both Norfolk Southern and CSX operate east of the Mississippi, and thus, they share some resources. This also explains why CSX has a high ‘Other Assets’ percentage in its upper half of the balance sheet.
Norfolk Southern’s intrinsic value is estimated at $195 per share. There is a positive impact from the strong dividends on earnings analysis; thus, adding 4% is a reasonable adjustment to intrinsic value for the strong dividend payout ratio. The result is that Norfolk Southern’s intrinsic value for 2021 is approximately $203 per share.
Canadian National
Canadian National’s dividend and earnings analysis demonstrates a positive impact on its intrinsic value. It’s greater than 25% dividend ratio payout adds value to the core intrinsic value. A value investor would add about 2% to the core intrinsic value calculated.
Canadian Pacific and CSX
Review of the dividends to earnings payout ratio table from above reveals that both Canadian Pacific and CSX are just below and above the minimum dividend payout determined. In effect, the dividends’ impact on intrinsic value is minimal and thus not worth calculating. The absolute value change is no more than 1% of the intrinsic value, which is considered insignificant.
Summary – Dividends and Earnings Analysis for Railroad Stocks
Dividends and earnings analysis are required for any intrinsic value calculation for high-quality stocks. There are different methods and tools to determine intrinsic value. The dividends and earnings analysis is just a small part of the formula.
Dividends and earnings have a relationship with each other. Earnings are used to:
- Pay dividends to shareholders;
- Retained to reduce debt and/or expand existing assets;
- Conduct research and development for new products/services; AND
- Held in reserve for adverse times.
With railways, conducting research and development is limited in scope and, as such, not really one of the uses of earnings. Review the balance sheet relationship annually to validate the position each railroad holds with the debt-to-equity ratio. In addition, update the dividends to earnings chart from above to understand if the respective railroad is increasing or decreasing the dividend payout ratio. In general, investors desire dividends. Dividends are not a requirement for value investors, but it is beneficial. The key is that if a company has a strong dividend payout, the market price for the railroad will recover in a shorter period of time than other railroad stocks. Furthermore, those companies with lower payout ratios (less than 25%), value investors will want to decrease the intrinsic value by three to five percent and demand greater safety of margin by buying at more than 18% price points below intrinsic value. It is the only way to maintain good returns on an investment.
With those railroads with strong dividend payout ratios, value investors can increase the intrinsic value basis four to five percent and/or purchase the respective security when there is a smaller deviation in price below intrinsic value. Value investors may consider buying with only 15% dips from intrinsic value.
In the overall scheme of investing, some value investors use the dividend payout ratio as a supplemental benefit and do not adjust intrinsic value at all. In effect, when making buy and sell decisions, nothing changes except that the value investor prefers stronger payout ratios as these stocks recover faster than the other members of the respective pool. For the reader, it is important to understand this dividend and earnings relationship with any investment made. In general, higher ratios are more beneficial than lower payout ratios. Simply adjust your decision matrix accordingly.
As for this site’s railways pool, historically, the pool has made its good returns off both Union Pacific and Norfolk Southern. Furthermore, this site’s railways pool only sells PUTs for Union Pacific and Norfolk Southern, as both railroad companies are favored over the other four. Act on Knowledge.