
Huntington Ingalls Industries, Inc. – Market, Intrinsic & Value Investing Prices
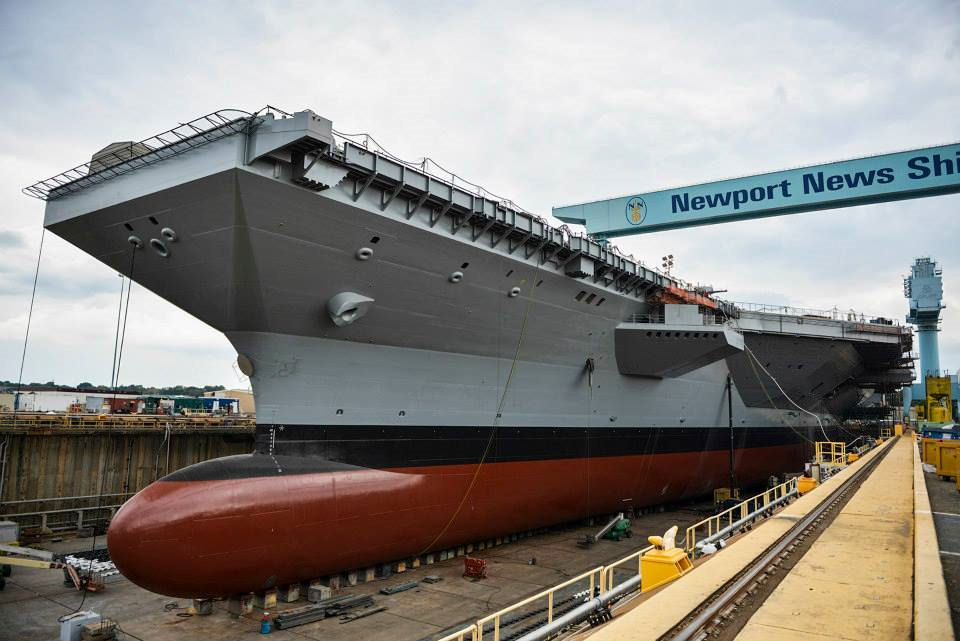
“We will build great ships. At a profit if we can. At a loss if we must. But we will build great ships.” – Newport News Shipbuilding Mission Statement.
The largest subsidiary of Huntington Ingalls Industries is its Newport News Shipbuilding division. They are the sole builder of the United States Navy’s aircraft carriers. Newport News Shipbuilding has been in business for over 140 years. Huntington Ingalls Industries has three distinct segments of operations. In addition to Newport News Shipbuilding, Huntington Ingalls Industries has its Ingalls division, which builds non-nuclear combatant vessels, including Coast Guard Cutters. A third division is their Technical Solutions segment, which provides intelligence services to the Navy. With 44,000 employees and a backlog of $50 billion of work, Huntington Ingalls Industries is an excellent inclusion in any value investing portfolio. With this site’s Value Investment Fund, this particular company is included in the Military Contractor’s Pool of investments.
The current market price as of November 20, 2021, is around $185 per share. With 40.6 million shares in the market, its market value is around $7.5 billion. Therefore, this company is considered a mid-cap investment. However, the company consistently generates increasing amounts of revenue and outstanding profits. For investors, it also pays excellent dividends that often exceed a 2.5% dividend yield. The risk associated with a deep decline in the stock’s price is practically non-existent, and more importantly, even if one occurred, the likelihood it will stay depressed for more than two years is remote. Even though this company falls within the mid-capitalization group of investments, it behaves like a large-cap. Simply stated, if a value investor can snap up shares at a good price, odds are, the investment will provide superior returns when the stock’s price returns to a favorable market price. The questions are now: ‘What is Huntington Ingalls Industries, Inc.’s intrinsic value, value investing buy price, and the market recovery price for value investing?’.
Huntington Ingalls Industries – Intrinsic Value
There is no universal formula to determine intrinsic value. There are about six commonly accepted methods (formulas), and each is highly dependent on certain conditions existing to have a high level of confidence in the result. The larger the company, the greater the confidence in certain intrinsic value methods over others. Thus, a value investor seeks out distinct conditions that provide greater credence to one intrinsic value formula over another. The key to determining intrinsic value for Huntington Ingalls is to focus on its core customer, the United States Navy. Newport News Shipbuilding, Huntington Ingalls Industries’ largest subsidiary, has been building aircraft carriers for the Navy since 1930. There has never been a lapse of any duration without a carrier under construction. In effect, this continuous demand for ships makes Huntington Ingalls recession-proof. Any kind of consumer impact on the economy has no or very little effect on the long-term contracts related to vessel construction. In addition, these contracts have inflation adjustment clauses along with material shortage impact clauses. It is easier to forecast revenues and profits with military contractors than consumer-oriented operations. Take a look at the last 13 years of revenues and profits for Huntington Ingalls Industries (2021 is estimated based on actual information from the first three quarters as reported).
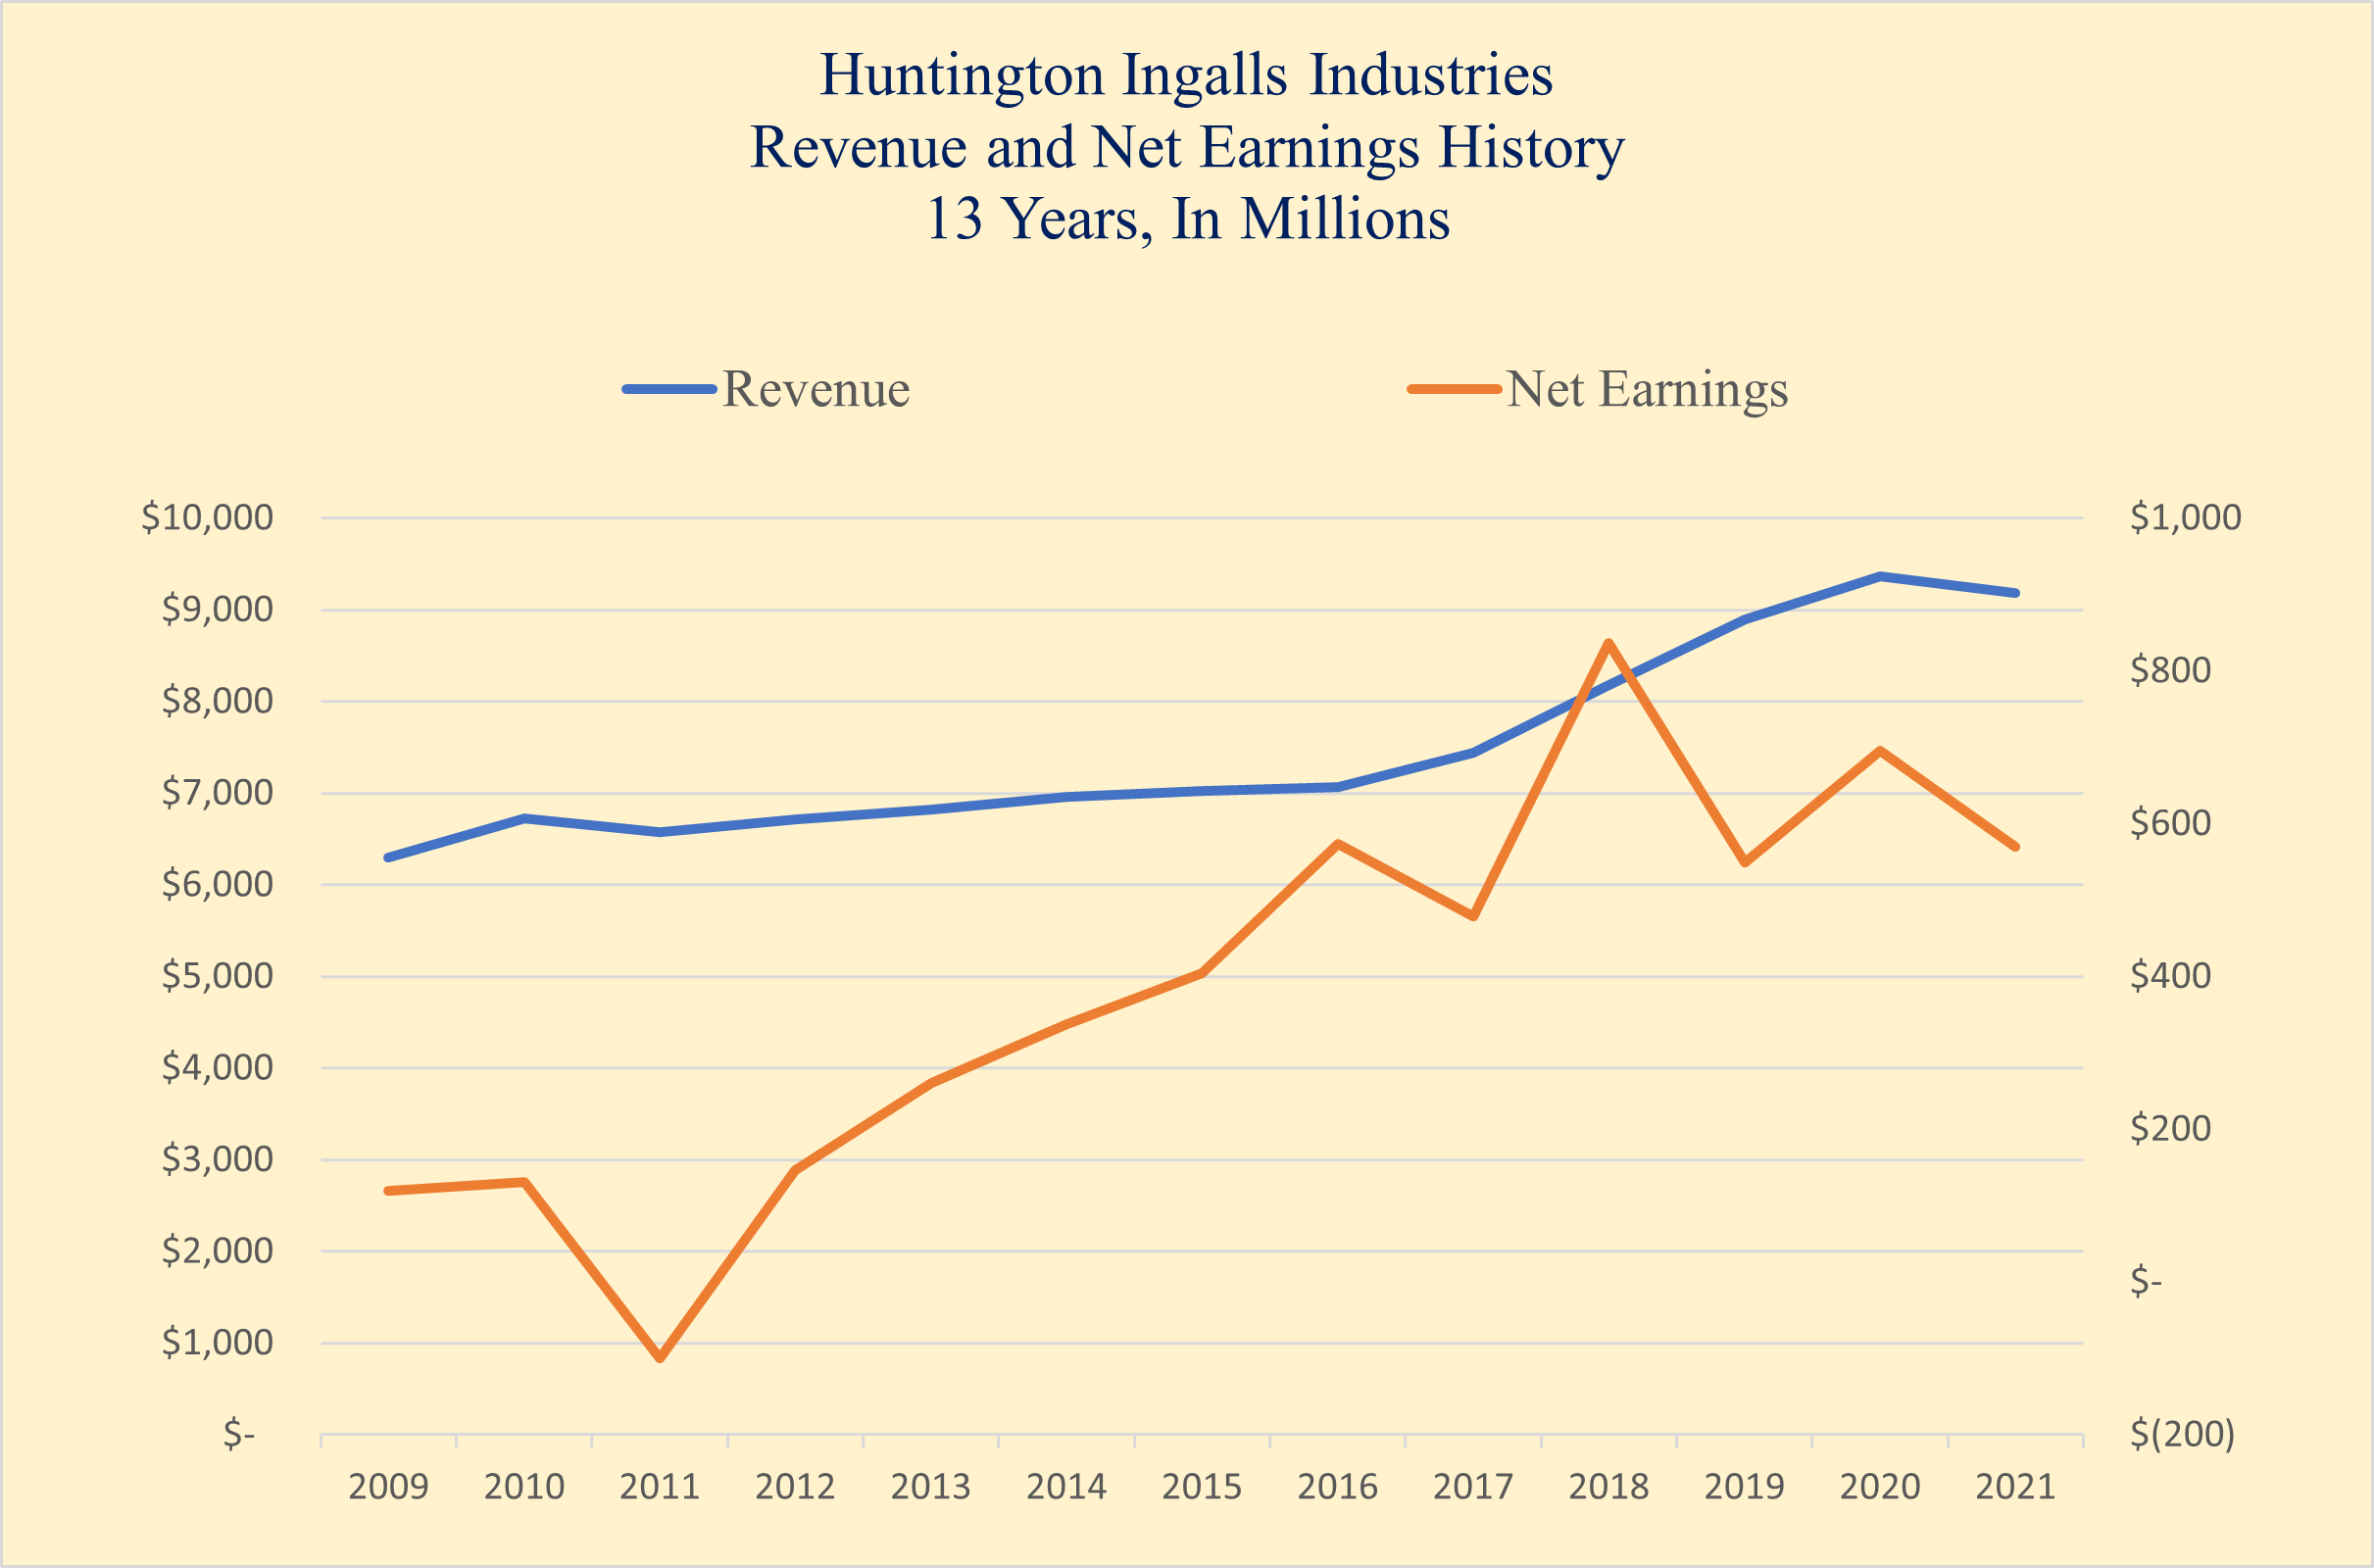 This graph depicts the relationship between revenues and profits. Basically, the last six years have seen a step-up in profitability that consistently exceeds $500 million per year. Thus, with 40.6 million shares, each share is earning at least $12 per share. The recent six years have also seen a shift to a higher level of revenue. The primary driver of this elevated level of sales is to full operations of the third segment, Technical Solutions, of Huntington Ingalls Industries. Therefore, it is reasonable, and with a high level of confidence, to predict that overall sales will exceed $8.7 billion per year for the foreseeable future. Thus, it is also reasonable to expect no less than $500 million in net earnings each year for several years to come.
When setting intrinsic value, one of the goals of a value investor is to set a reasonable range of value to act as a guideline with actual outcomes from the various intrinsic value formulas. Using a simple price-to-earnings relationship of 13 to 1, Huntington Ingalls is worth at least $155 per share; at 16:1, the price exceeds $192 per share. Thus, it is fair to say that the intrinsic value will fall somewhere between $220 (18:1) on the high end and $140 (12:1) per share at the other end. Those methods that can produce a result within this range are more reliable than outcomes outside of this range when determining intrinsic value.
Intrinsic value formulas are grouped into three types. The first and highly reliable approach for fixed asset-intensive companies is driven by balance sheet outcomes. The absolute best method in this group is resetting all assets to fair market value, subtracting liabilities to end up with an adjusted net worth. A second group of intrinsic value formulas is oriented around the income statement and includes net present values of earnings, cash flow, and free cash flow. The final group of intrinsic value formulas focuses on the equity section of the balance sheet and includes book value, dividend yields, and a combination of both.
Intrinsic Value Driven by Fixed Assets
Intrinsic value calculations are very effective when utilizing a fair market value step up or down for fixed assets and subtracting the corresponding liabilities to determine overall net worth. This formula is extremely accurate for estimating the value of real estate-intensive companies like REITs and farming. It is marginally valuable for companies with lots of equipment or assets that are customarily traded in the consumer market; think of autos, RVs, and boats. The drawback for a company like Huntington Ingalls Industries is that there are very few buyers of heavy equipment or even shipyards as a whole. But there is one aspect of heavy equipment-intensive operations that can assist with identifying value: replacement costs. With Huntington Ingalls Industries, replacement costs of the property, plant, and equipment will easily exceed the original cost of the assets. Take a look at Huntington Ingalls’ asset side of the balance sheet as of 12/31/2020.
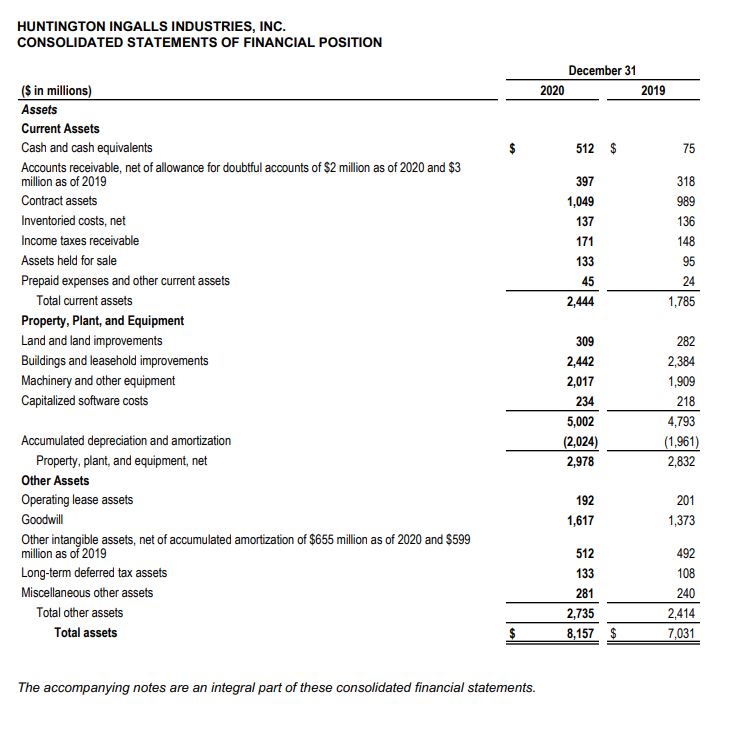 The key is to focus on Property, Plant, and Equipment. Do you notice that lifetime accumulated depreciation is $2,024 million ($2.02 billion)? Most of the equipment shipyards use lasts for tens of years – heavy-duty cranes, slipways, concrete, building structures, and piers. Simply stated, replacement costs will easily exceed their original capital outlay. A shipyard is truly a long-term investment. Thus, it is fair to say that all these assets have value that easily exceeds their original cost. Furthermore, the company invests over $140 million per year to maintain or expand its fixed assets.
Therefore, when looking at the property, plant, and equipment, they are, at a minimum, worth their original cost. Thus, total assets at original cost basis value exceed $10.1 billion ($8,157 M plus $2,024 M in accumulated depreciation). Total liabilities on 12/31/21 equal $6.3 billion. The difference between fair market value and liabilities, the amount assignable to shareholders is $3.8 billion. This means that each share is worth at least $93.60.
Thus, even with a step up in value tied to the fixed assets, the result from this particular intrinsic value method is well below the minimum estimated intrinsic value determined above of $140 per share.
Even if you stepped up the value for goodwill and other intangibles by $600 million, it only adds about $15 per share of additional intrinsic value.
How can it be that such a large fixed asset-intensive operation has such a low valuation tied to the market value of fixed assets? The answer is simple: there are not enough buyers of the fixed assets to warrant a higher market value. Unlike residential real estate with lots of buyers that drive up value, shipyards have a narrow well well-defined purpose, and this in turn affects market value for their assets. The assets only have one purpose; therefore, this particular method is unreliable. A value investor must shift away from balance sheet formulas towards a tool that is more reliable to gain confidence and increase accuracy in the result. When a company has a consistent history of improving revenues and increasing profits, income-based intrinsic value formulas are superior to asset-based formulas.
Intrinsic Value Derived Using Net Present Value Formulas
The net present value formula is a banking financial algorithm that takes a future known value and discounts it back to today’s value. Think of it as an inflation-adjusting formula; with net present value, this inflation-adjusting function is determined with a discount rate. When a lender is reluctant to loan money, they increase the discount rate to offset the risk of lending money.
Net present value is very effective when the future stream of payments is steady and predictable. That is why it is commonly used with loan calculations. Loan payments are often preset in amounts over extended periods of time. When discounting future payments, those way out in time generally have little impact on the outcome. Think of receiving a $100 payment in forty years. What is that payment worth in today’s dollars? At low discount rates like less than 7%, a $100 payment forty years from now is worth about $6.68 today. At 11%, that same $100 is worth $1.54. Thus, it is extremely critical to use a reasonable discount rate with intrinsic value formulas when trying to determine the value of future income. But in general, the rule is that those payments beyond 25 years will have such a minor impact on the final determinant that it will not impact a value investor’s final decision model.
Value investors use this formula for companies like Huntington Ingalls Industries because Huntington has a strong and long history of making money, and therefore, it is easier to predict future earnings. To use this formula, a user needs at least two pieces of information. The first is the future stream of payments, and the second is a discount rate.
Future Stream of Payments
There are several accepted streams of payments to act as the basis for this formula. The most widely accepted value is a company’s net earnings. These earnings are used to pay dividends, reduce debt, and purchase more assets. Simply stated, all these uses benefit the shareholders both currently (dividends) and in the future by expanding operations or reducing costs that in turn improve future net earnings, which then in turn benefit shareholders.
If you go back up to the graph from above, over the last 13 years, Huntington Ingalls Industries has generated over $5 billion in net earnings. On average, that equals $384 million per year. But notice something important in that graph. From 2016 on, the net earnings per year have stepped up into the $500 million-plus range. The average over the last six years is $617 million per year. More conservative value investors dampen this average in order to improve confidence with the result. It is reasonable to assume that at least 80% of this value will be the net earnings in the future. Thus, using $494 million as the average annual net earnings, what is the net present value of these future earnings? There is now one piece of the formula established. A second piece of information is now required: a discount rate.
Discount Rate
How does a value investor determine the discount rate? The key is understanding what a discount rate is. The textbook answer is that a discount rate is the risk factor for a lender of money; in this case, what a shareholder is willing to pay to receive future income, dividends, and an increase in the share’s price over a period of time. The higher the discount rate, the less faith one has in the investment. Low discount rates intimate a lot of faith in the creator of the investment. This is why government investments have very low discount rates. Typical government rates are just a little higher than expected inflation rates.
For Huntington Ingalls Industries, determining the discount rate is a function of four core elements of the discount rate. They are as follows and include a simple definition:
- Risk-Free Rate – This is the rate that exists with Treasury notes. It is what most investors will accept without any risk.
- Equity Risk Rate – A rate an investor is willing to accept given the position they fall within the spectrum of ownership rights, i.e., equity positions range from 4% to as high as 7%. Bondholders are in the 3% to 5% range. Secured bondholders have less risk involved and are in the 2.7% to 3.5% range.
- Size Premium – An additional 1% to 4% depending on the size of the company. For example, Walmart’s size premium is around 1%. Mid-Cap investments are in the 2% to 3% range, whereas penny stocks are slightly more than 4% premium.
- Specific Risk – A factor associated with the purpose of the investment and the ability to sell the respective investments promptly. In this case, Huntington Ingalls is stable, and it is easy to dispose of a stock position with Huntington Ingalls. A bond position would require a higher specific risk. Overall, specific risk ranges from 0% (McDonald’s stock position) to as high as 4% for an over-the-counter stock purchase.
Huntington Ingalls Industries’ discount rate is determined as follows:
- Risk-Free Rate 2.25%
- Equity Risk Rate 5.25%
- Size Premium 1.50%
- Specific Risk .75%
The total discount rate for Huntington Ingalls Industries is estimated at 9.75%.
Application of the Formula
It is easy to determine the minimum overall worth of the anticipated future net earnings. Using the net present value formula, twenty-five years of $494 million per year in earnings is worth about $4,572 million ($4.6 billion). On a per-share basis, the minimum net present value of future net profits equates to $112.61. At a discount rate of 8%, the value improves to $130 per share.
Again, this amount is not within the range initially expected. If the average net future earnings are set to the actual average earnings of $617 million per year and using a discount rate of 9.75%, each share’s value improves to $141 per share. This result is within the expected range of intrinsic values.
Can this be improved upon?
Many analysts will argue that the stock is worth not only the value of the future earnings, but also some terminal value related to the company’s fixed and current assets at that time. This is only true for those entities with long-term life expectancies; shipyards are ideal examples and have an intensive fixed asset exposure. Assuming that a good portion (2/3rd’s) of net earnings are used to strictly improve the balance sheet by paying down debt and the other third is paid out as dividends, then in 25 years the debt will be paid down approximately $3.8 billion, leaving a balance due of $2.5 billion. Taking it further, we can assume that all intangibles are worthless but that the property, plant, and equipment is worth at least its current cost basis on the balance sheet. This means that the terminal value of the company is estimated at $5,000 million ($5 billion). This, on its face, appears reasonable. After all, these are shipyards, and they will have value in 25 years; they have been around for over 100 years, and ships will be needed in 25 years. This terminal amount would not be applicable for other industries such as manufacturing, pharmaceuticals, or retail. It is acceptable to have a terminal amount with real estate, utilities, transportation, and mining industries.
Adding a terminal amount of $5,000 million 25 years from now, the total net present value of future earnings and a terminal payment of $5 billion is worth about $6.2 billion. On a per-share basis, this is worth around $152.71. Notice that a terminal amount adds about $12 per share.
There is one inherent flaw in the formula. It assumes that future net earnings remain steady. The reality is that they will improve. Go back to the graph from above. The trend line is an upward trajectory. The question is, what is the actual growth rate? The growth rate is heavily influenced by the more recent years of net earnings improvement. For reasons of brevity, an in-depth analysis is not presented here. The actual stabilized growth rate is 2.4%. The net present value formula is then adjusted by 2.4% for each year into the future. The per-share price improves to $192.56. Take note, growth significantly improves the intrinsic value outcome with a net present value formula. A 2.4% growth rate adds another $40 per share. Growth rates of 3% and higher will result in no less than a $220 per share intrinsic value outcome.
This substantiates the initial thinking of intrinsic value at the high end of $220 per share. Remember, in order to reach the higher initial intrinsic value initially conceived, more liberal factors are applied. In this case, it assumes the following:
- There will be net earnings into the future starting at $617 million/Year;
- Earnings will improve about 3.0% per year, year over year, into the future;
- There is a terminal value of about $5 billion in the 25th year from now;
- The discount rate is estimated at 9.75%.
A value investor could apply even more liberal factors and hit $250 per share. This could include stronger growth rates, a lower discount rate, like 8% and a higher terminal value. The key is to understand that it is important to only use reasonable factors when calculating intrinsic value with a net present value formula. Too liberal with the factors, and the intrinsic value skyrockets; too conservative, and the value decreases to a point where an opportunity to buy at that price will never materialize.
All of the above assumptions are fair and reasonable. If a value investor wanted to determine a more conservative position, the assumptions could be modified as follows:
- There will be net earnings into the future starting at $494 million/Year;
- Earnings will improve about 1.2% per year, year over year, into the future;
- There is a terminal value of about $2 billion in the 25th year from now;
- The discount rate is estimated at 11%.
The final per-share value is then equal to $118. It is highly unlikely that Huntington Ingalls Industries’ share price will drop to $118 per share. Look at its historical price over a ten year window.
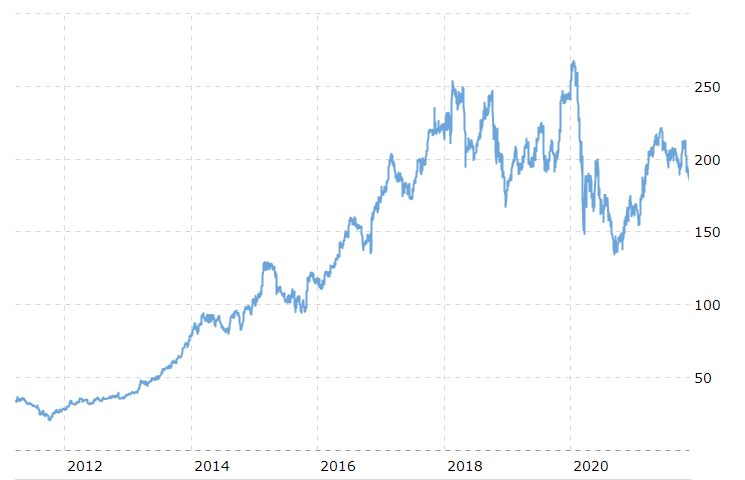
This depiction of the share price matches the revenue line from above. The last time the share price hit $118 per share was back in early 2016. It is highly unlikely it will ever dip that low again. Thus, strong conservative factors with the discount rate will eliminate any opportunity to purchase this stock as a value investor.
The goal is to have a result from one of the many different value investing formulas that a value investor can rely on with high confidence that this represents intrinsic value. The outcome should be somewhere from $140 to $220 per share.
Is there another net present value formula available that could be used? Yes, there is.
A second and very popular variation of the net present value formula is to use cash flow and not earnings, specifically, cash flow from operations.
Why cash flow from operations? And why would cash flow be a better stream of values than net earnings? To answer this, a value investor must first understand the basics of cash flow.
Cash Flows
Generally Accepted Accounting Principles (GAAP) requires accountants to take into consideration not only the direct costs of building ships, but also indirect costs. Indirect costs include overhead and allocation of long-term expenditures related to the purchase of tools, equipment, yard improvements, and structures. This allocation of these large and significant capital outlays is referred to as depreciation. Remember, with a capital-intensive purchase like a crane, the initial outlay is referred to as an investment in equipment. The crane is utilized over decades, and as such, its initial capital outlay is allocated over its functional life. The cash outlay was upfront, thus depreciation represents a non-cash allocation of initial cost. In a typical calculation of net earnings, there was a deduction associated with depreciation. With Huntington Ingalls Industries, depreciation was $191 million in 2020. Thus, this one line item alone impacted the per-share earnings by $4.70. There are others for Huntington Ingalls Industries:
- Amortization – allocation of goodwill and other intangibles $63 Million in 2020
- Stock Based Compensation – payroll without cash outlay $23 Million in 2020
- Deferral of Income Taxes – deduction now, but is owed in the future $23 Million in 2020
In total, Huntington Ingalls added back $397 million in non-cash expenditures and other adjustments in 2020. In effect, its cash flow from operations was $1,093 million ($1.1 billion) in 2020. This significantly increases the result related to the net present value formula. The average cash flows from operations from the previous six years are $900 million per year. Using the same factors from above of a discount rate of 9.75% and a terminal value of $5 billion, the net present value of cash flow is $8.8 billion or $216.75 per share.
It still does not answer the question of whether cash flow from operations is superior to net earnings as the basis of the net present value formula.
To determine an answer, a user of this formula must first understand the ‘Big’ picture. GAAP-based earnings reflect true earnings normalized. Cash flow reflects not only earnings but the impact the balance sheet has on earnings. Think of cash flow as a function of both the income statement and the balance sheet combined. Earnings are tied only to the income statement. With fixed asset-intensive operations, the cash flow from operations is almost always greater than net earnings due to depreciation and amortization. However, at some point, this extra cash must be invested back into the property, plant, and equipment to maintain it or replace expired assets. The outcome affects the terminal value. The extra cash is used to maintain that terminal value at a higher level. Imagine the value of the property, plant, and equipment 25 years from now if this extra cash isn’t used to maintain its current replacement cost. Instead of a $5 billion terminal value, terminal value might only be $2 billion. If the terminal amount is reduced $3 billion, the per-share intrinsic value outcome derived from cash flows from operations decreases to $8.5 billion, and the per-share value decreases to $209 per share.
This is why some analysts use the ‘Free Cash Flow’ as the basis of determining net present value. Free cash flow reduces cash flow from operations by the minimum required amount to maintain the existing property, plant, and equipment such that the terminal value is not affected. The ‘Free Cash Flow’ average for Huntington Ingalls Industries over the last six years is $533 million. Take note, the ‘Free Cash Flow’ average is less than the net earnings average for Huntington Ingalls Industries. Thus, the market value for Huntington Ingalls Industries using free cash flow as the basis in the net present value formula is $5.421 billion. This equates to an intrinsic value of $133.52. This is without any growth rate.
Utilizing a 2.4% growth rate, the intrinsic value per share improves to $169.21.
Notice how much more comfortable this outcome is over others? It utilizes ‘Free Cash Flow’, thus providing a high level of confidence in a $5 billion terminal amount. Secondly, this free cash flow outcome is less than average net earnings over the last six years, but is not as conservative as the 80% ratio utilized in the very conservative approach from above. It is using a reasonable discount rate of 9.75% and an expected growth rate of 2.4%.
As with the net earnings formulas from above, the value investor could use more liberal values, such as a growth rate of 2.7%, or a discount rate of 9.5% or a terminal value that is $1 billion higher. This pushes the intrinsic value higher into the $175 to $190 range. Again, as stated and illustrated above, the more liberal the factors, the higher the intrinsic value. The more conservative, the lower the outcomes. The key is to use ‘Reasonable’ values when determining intrinsic value with the net present value formulas. In this case, this author endorses the following:
- Terminal Value $4,500 Million
- Discount Rate 9.6%
- Adjusted Stream (Free Cash Flow Adjusted by Grant Proceeds, See Cash Flows Statement) 575 Million
- Growth Rate (Improvement over 2.4% due to recent purchase of Alion Science) 2.6%
The intrinsic value outcome using the above factors in the formula results in a total value of $7,520 million or $185 per share.
Is there a way to improve our confidence in this value? Are there any equity-driven intrinsic value formulas that will support this outcome?
Intrinsic Value Driven by Equity-Based Formulas
There are several different intrinsic value formulas centered around the equity section of the balance sheet. The primary basis of equity-based formulas is that a company is only worth the book value of its shares. In effect, why would anyone pay more than the book value for a share of stock? After all, the book value reflects a company’s lifetime to date in earnings less dividends/buybacks paid out to shareholders.
The answer focuses on a core belief that the value of a complex asset is greater than the sum of its parts. Without a doubt, book value reflects a summation of the company’s parts. But value goes beyond the sum of its parts to include hidden assets. In the case of a shipyard, no value is posted to the assets side of the balance sheet, reflecting the individual skill sets and talent of the 44,000 employees. Some of these employees have certifications that exist with fewer than 1,000 people worldwide. For example, those individuals qualified to handle, engineer, or install nuclear fuel rods are few worldwide. Not to mention the fact that these are naval systems, and the security clearances required are steep. Add to this some super-secretive information, such as sonar for submarines and navigation technology; it just illustrates tremendous value beyond simple book value. It has taken Newport News Shipbuilding decades to acquire this knowledge, develop systems and programs to ensure the longevity that this proprietary expertise is properly passed from one group of employees to the next.
There is still another hidden value that exists. How many deep draft water ports are there in the world? There might be 100 worldwide. Huntington Ingalls Industries owns two of them. The original cost of that land and the development of access to the respective slipways were done decades ago. Today’s costs to build or develop this property would run into the billions of dollars. This is why it was stated earlier that replacement costs of these assets will easily match the original cost as recorded on the books. Simply stated, this company’s assets are worth every bit of $10 billion. The corresponding liabilities are $6.3 billion; thus, the true net worth is at least $3.7 billion. This alone equates to $91 per share.
The real value is that this company has no ongoing concern issues. Unlike other industries, shipbuilding, especially naval vessel construction, will be around in five, seven, and ten years. It isn’t that this company is too big to fail; it’s that its products are required by the world’s largest navy. It takes four years to build an aircraft carrier and get it ready for sea. Huntington Ingalls Industries currently has three aircraft carrier contracts, not to mention numerous submarine construction contracts. With a fifty billion dollar backlog, its long-term existence is guaranteed.
Thus, this ongoing operational status will generate positive net earnings well into the future. Furthermore, these net earnings allow for dividends. Look at the dividend payouts over the last 8 years:
2014 $1.00
2015 $1.70
2016 $2.10
2017 $2.52
2018 $3.02
2019 $3.61
2020 $4.23
2021 $4.60
On average, Huntington Ingalls Industries has paid out at least $3 per share. Assuming a reasonable growth rate of 2.0% per year and using an equity position discount rate of 5.25% (see above), the current value of dividends is estimated at $51 per share. Add to this the current market-adjusted book value of $91 per share, and the cumulative value for ownership of stock with Huntington Ingalls is around $142 per share. Using a $4.20 per year dividend rate, the dividends are worth $71; thus, the cumulative total improves to $162 per share.
A variance on this approach is commonly referred to as the dividend yield. In this case, a receiver of dividends will state their preferred annual interest rate for an investment and can derive a stated value for a share. The dividend yield formula is stated as:
Dividend Yield = Dividends/Price Per Share Paid
In this case, using $4.60 per share as the dividend rate and desiring a 3.5% annual yield, the market price per share is:
3.5% = $4.60/Share Divided by Price Per Share; Therefore:
Price Per Share = $4.60/.035;
Price Per Share = $131.42
If the investor reduces their desired yield to 2.75%, the price they are willing to pay per share jumps to $167.27. Notice that with this method, there is no inclusion of a terminal value. This is because the purpose is to own the stock purely for dividend receipts. This intrinsic value method is more reliable for very high dividend payout operations, those exceeding 70% of earnings, such as Coca-Cola, REITs, and many of the gasoline manufacturers. As with the net present value method, the higher the desired yield, the lower an investor is willing to pay for the investment.
Finally, there is one other intrinsic value formula used with equity. It is simply the price-to-earnings ratio. This was illustrated in the opening section above to identify a range that an investor is willing to pay for the net earnings of a company. The price-to-earnings ratio’s inherent flaw is that it reflects current earnings and is used in the market as a barometer of value. Value investors do not use the market to identify intrinsic value. Intrinsic value must stand alone. The P/E ratio merely provides limits of a range of expected intrinsic values. The P/E ratio is only effective if the earnings are stable and rarely deviate from a given value. In addition, earnings must be true, which means that there are very few adjusting factors or adjusting amounts related to determining cash flow from operations or free cash flow. With Huntington Ingalls Industries, the P/E ratio is ineffective due to the many adjusting factors and dollar amounts for calculating cash flow, free cash flow, and actual earnings (the financials report net earnings and adjusted net earnings).
Side Note
One of the common adjusting factors from traditional GAAP earnings relates to the company’s retirement plan, i.e., the pension plan. Of the $6.3 billion of liabilities, the cumulative employee retirement benefits, including the pension plan, share is $1.5 billion. The pension plan is monitored by ERISA (Employee Retirement Income Security Act) and is currently funded with about $7.7 billion. Its projected obligation is $8.7 billion. Thus, there is an unknown potential liability if the pension plan’s current assets (marketable securities) decrease significantly, tied to the overall economy. This, in turn, will require Huntington Ingalls Industries to increase its yearly contribution to the plan to ensure the plan’s long-term viability. On average, this obligation impacts net earnings by at least $3 per share per year. This affects the final intrinsic value outcome significantly. All the above factors related to calculating intrinsic value include the impact of the pension plan. Most analysts exclude the pension plan costs and, as such, end up with higher intrinsic values as outcomes. Simply stated, the long-term legal obligation of the pension plan affected the above intrinsic values anywhere from $14 per share to as much as $22 per share.
Huntington Ingalls Industries – Final Intrinsic Value Calculation
These are the results of the various intrinsic value formulas used:
Price to Earnings Ratio from 12 to 18:1 Expected Range of $140 – $220/Share
Step-Up to Replacement Costs for Property, Plant, & Equipment $94/Share
Net Present Value of Earnings (Conservative Factors) $113/Share
Net Present Value of Earnings (Liberal Factors) $141/Share
Net Present Value of Earnings w/Terminal Value (Conservative Factors) $125/Share
Net Present Value of Earnings w/Terminal Value (Liberal Factors) $153/Share
Net Present Value of Earnings w/Terminal Value & 2.4% Growth (Conservative Factors) $165/Share
Net Present Value of Earnings w/Terminal Value & 2.4% Growth (Liberal Factors) $193/Share
Net Present Value of Cash Flow (Conservative Factors) $217/Share
Net Present Value of Free Cash Flow (Conservative Factors) $133/Share
Net Present Value of Free Cash Flow (Liberal Factors) $169/Share
Net Present Value of Adjusted Free Cash Flow (Reasonable Factors Overall) $185/Share
Book Value Adjusting Property, Plant, & Equipment to Market Value $91/Share
Adjusted Book Value Plus Discounted Dividends @ $3/Share $142/Share
Adjusted Book Value Plus Discounted Dividends @$4.20/Share $162/Share
Dividend Yield of 3.5% $131/Share
Dividend Yield of 2.75% $167/Share
Notice at least six common intrinsic value formulas:
- Asset Adjustment
- Net Present Value of Earnings
- Net Present Value of Cash Flow from Operations
- Net Present Value of Free Cash Flow
- Book Values
- Dividend Yield
Altogether, there were 16 intrinsic value calculations used tied to six common intrinsic value formulas. The outcomes range from a high value of $217 per share to a low of $91 per share. As with many analysis practices, typical highs and lows are tossed as unusual outcomes, leaving thirteen final results (tossed both values in the 90s and the single value over $200). The outcome range narrows from $113/Share to $193/Share. Those share prices lower than $140 were excluded because they simply were below the minimum expected outcome of $140 per share. This leaves nine outcomes that are within the range expected and not an outlying value (the $217 result). Four of the nine remaining results were for prices in the $160’s. Thus, it is reasonable to expect the final intrinsic value to be at least $160 per share. A value investor’s goal is to approximate a reasonable outcome that is not set so high as to reduce final returns, nor too low such that there is no likelihood of the market price dropping to this value except in extreme situations. A low intrinsic value eliminates adequate opportunities to buy the stock and make good returns upon market price recovery.
The one formula that stands out from the rest is tied to adjusted free cash flow. This reflects a lower terminal value than many of the others at $4.5 billion; in addition, it is using a stream of values reflecting free cash flow adjusted higher by grants provided by the Navy and local governments for improvements. Finally, the recent purchases of several companies over the last three years, expanding the Technical Solutions segment of operations, should begin to pay off with an increase in overall net earnings. Thus, a reasonable growth rate of 2.6% is acceptable and fair.
The intrinsic value of Huntington Ingalls Industries, Inc. is $185 per share. This is derived using a discounted free cash flow formula adjusted for government grants along with reasonable factors, including a discount rate of 9.6%, an expected growth rate of 2.6%, a conservative terminal value of $4.5 billion, and a window of time limited to 25 years. Overall, this set of variables leans more conservative than liberal, which in turn increases the confidence that the outcome is very close to a reasonable expectation.
Huntington Ingalls Industries – Buy Price
When calculating intrinsic value for any company, there is a risk that one of the many factors (variables) used could have been overstated (too liberal), and as such, the outcome is also overstated. The nearest lower value to the preferred intrinsic value formula used free cash flow with liberal factors and resulted in a valuation of $169/share. There is no need to analyze this further; the value is somewhere in between the two outcomes. Given the size of this company, its performance, and long-term outlook, splitting it down the center between this outcome and the intrinsic value of $185 is acceptable. The reality is that a value investor is adding one last layer of conservative application to improve the overall level of confidence. This reduction from intrinsic value is commonly referred to as adding a margin of safety.
The buy price of Huntington Ingalls Industries for a value investor is $177 per share (the split between the calculated $185 per share and the free cash flow outcome of $169 per share). This is driven by utilizing a fair and conservative terminal value, a reasonable expected growth rate, and adjusted free cash flow over 25 years, discounted at a 9.6% rate reflecting the unobjectionable fact that Huntington Ingalls Industries will be producing Naval vessels for many years to come.
Summary: Huntington Ingalls Industries – Market, Intrinsic, and Value Investing Buy Price
“We will build great ships. At a profit if we can. At a loss if we must. But we will build great ships.” Newport News Shipbuilding’s mission statement says it all. This is a good company dedicated to the United States Navy and the sailors who man these vessels. In return, the government allows Huntington Ingalls Industries to earn a fair and reasonable profit for the products and services it provides. This is truly a long-term, mutually beneficial relationship. Any investor buying in at $177 per share can feel quite secure with their investment.
The current market price is in the mid $180’s, and the intrinsic value is $185 per share. Purchasing Huntington Ingalls at $177 or lower will provide an excellent return for the investor. Even with a low market recovery price of $220 per share and taking two years to get to this market price will provide no less than a 14% annual return on the investment. If the market recovery price is reached within one year, the return exceeds 27%. In general, a value investor can feel highly confident that, at $177 per share that there will be a good return on the investment. Act on Knowledge.