
Starbucks – Intrinsic Value for Value Investing
“To inspire and nurture the human spirit – one person, one cup, and one neighborhood at a time” – Starbucks’ Mission Statement.
Starbucks is currently one of the members of this site’s Value Investment Fund’s Fast-Food Restaurants Pool of securities.
What would you pay for a stock that has the following negative attributes?
- A book value of MINUS $7.33 per share (yes, you read that correctly, a negative book value);
- A recorded deferred liability to Nestle Corporation for almost $6.6 billion;
- Recorded a decrease in the company’s already negative equity position of another 60%, i.e. $3.1 billion more during the most recent quarter (1st quarter of 2022);
- Has 5,358 locations in China, which is 31% of its corporate-owned stores (think of risk exposure if there is a military altercation between the US and China);
- Spent $3.5 billion to buy back 3.1 million shares when the price of its stock was at or near its historical high market value (1st quarter of 2022);
- Has long-term debt and leases totaling $23.5 billion with fixed assets of only $15.2 billion.
Yet, with all these negative factors, Starbucks’ stock price is currently in the mid-90s range and was selling at an all-time high of $126 per share back in the middle of the summer of 2021. Mind you, the company’s stock price was a mere $5 per share just 13 years ago. If you exclude 2020’s financial results due to COVID-19 and average the last 3.25 years (2018, 2019, 2021, and the 1st quarter of 2022), you get an average annual earnings of $4,040.8 Million ($4.04 Billion). Using Graham & Dodd’s core formula to calculate value and assuming a 6% growth rate, the total market value equals:
Average Earnings X ((8.5 plus (2 Times Average Expected Growth Rate)) = Market Value
$4,040.8 Million X (8.5 plus 12) = Market Value
$4, 040.8 Million X 20.5 = Market Value
Market Value = $82,836 Million ($83 Billion)
With 1,176.6 million (1.2 Billion) shares in the market, each share is worth about $70. At a more realistic 4.5% growth rate, each share is worth about $60. Even using the best quarterly results in the last four years and extrapolating this as the average quarterly amount for an entire year, average earnings per year would equal $5.93 billion, and with an average annual growth rate of 5.5%, the market value would approximate $115.6 billion or about $98 per share.
Thus, assuming some strong liberal values, at most, Starbucks (under Graham & Dodd’s core formula) is worth $98 per share. With more conservative elements of the formula, Starbucks is worth around $60 per share. Graham and Dodd’s formula was developed over 70 years ago, and before the stringent reporting requirements that exist today. Intrinsic value calculation has matured dramatically since then. In addition, the underlying tools to measure average earnings, growth rates, and the base multiplier have also made significant advancements since the 1960s. Thus, this article will illustrate that the actual intrinsic value is less than $50 per share, and this is using reasonable estimates for the elements of several different intrinsic value formulas. If a value investor were to use more conservative estimates, the intrinsic value drops below $40 per share. As a buyer of stock, understanding the intrinsic value of any investment is essential to make good decisions and build a reliable buy/sell matrix for any investment.
As with all intrinsic value formulas, the value investor must first grasp the overall business and financial model of Starbucks before proceeding to document outcomes.
Starbucks’ Intrinsic Value – Business and Financial Model
Starbucks’ business model almost mimics the fast-food industry model. Starbucks has approximately 17,150 corporate-owned stores. In addition, it has 16,700 licensed stores. Licensing is very similar to franchising; it’s really more legal than anything else. Starbucks charges for the products sold and an additional royalty of around 7% on gross receipts. Thus, Starbucks’ income per dollar of sales from its licensees is much stronger than other fast-food restaurant chains. From the Fast-Food Pool page on this website, Starbucks is considered one of the members of the informal eating-out industry, which most folks call fast food. Starbucks does have a third segment of income called Channel Development. This segment reflects sales of products through a master arrangement with Nestle. Thus, when you go to the grocery store and buy a bag of Starbucks coffee to brew at home, that sale is recorded in this segment of the company’s sales. It is a very minor segment in comparison to the two primary segments of sales – corporate-owned and licensed receipts.
Of all the fast-food members, Starbucks is by far the most international of them, far superior to even McDonald’s. Of the 33,900 stores worldwide, 17,000 are considered international. Those in Mexico and Canada are considered in the North American group, with 15,444 stores in the United States. Thus, Starbucks is truly reliant on foreign operations to elevate its status as a powerhouse company.
The financial model matches the business model. There are three sources of sales: corporate, licensed fees, and channel development. Corporate represents all sales at all corporate-owned locations. Whereas licensed sales only represent net receipts for products sold and royalties received tied to the licenses. It does not represent all the sales at the licensed locations. Channel development runs the standard sales, and its cost of sales is located in the costs of goods sold section of the income statement. Here is a snapshot of Starbucks’ sales from the past three fiscal years (Starbucks runs a 52-53 week year).
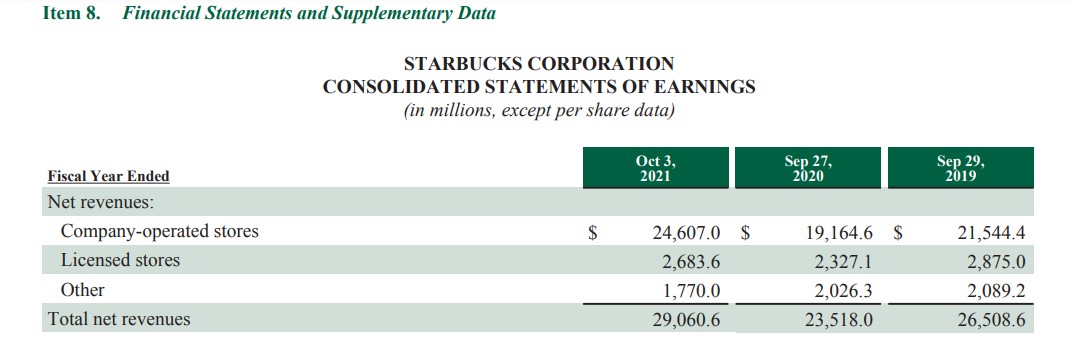
You can see the detrimental impact of COVID-19 in the year ending September 27, 2020, as the impact started in late February 2020.
Thus, 17,150 corporate-owned stores generated $24.6 billion in sales or about $1,435,000 per store per year. In comparison to the traditional fast-food restaurant, Starbucks sales on a per-store basis don’t even come close. A typical McDonald’s is in the $3 million range, and Wendy’s is in the $1.8 million range. Thus, the gross profit margin must be higher to generate enough absolute dollars of profit to offset the store’s operating expenses. And Starbucks does indeed do this. Their typical operating margins are in the 15 to 18% range, which is superior to all other fast-food operations. HOWEVER, Starbucks’ costs of capital, e.g., all that debt Starbucks carries, eat into the higher-than-others’ margin. In 2021, Starbucks paid almost $470 million in interest and is on track to pay almost the same in 2022. This interest cost dampens results dramatically and greatly affects how value investors approach calculating intrinsic value.
Here are the net profits for the last four years, excluding the fiscal year ending 2020 due to the impact of COVID. This excludes other comprehensive adjusting items (mostly international money exchange earnings due to the strong international market position and the power of the American dollar over other monetary systems).
2021 $4,199.3 Million
2019 $3,599.2 Million
2018 $4,518.3 Million
2017 $2,884.7 Million
The average, again excluding COVID-related impact, for the year 2020 is $3,800.4 million ($3.8 billion) per year. Average net revenue during this same period was $25,668.9 million ($25.7 billion/Yr). This means the bottom line profit for Starbucks is about 14.8% which falls well short of McDonald’s nearly 24% per year. Even adjusting McDonald’s to exclude the real estate segment of its profits, McDonald’s bottom line percentage is well over 20% for its corporate-owned and franchise operations.
Overall, Starbucks has more revenue than McDonald’s (McDonald’s has less than 4,000 corporate-owned locations while Starbucks has over 17,000 corporate-owned locations), and its model has a stronger royalty fee structure to boot. Yet, its overall profitability is dramatically lower than McDonald’s. This is a reflection of the higher per-dollar revenue costs to administer this company. This, too, affects intrinsic value formulas.
There are three major groupings of intrinsic value formulas. The first group focuses on the balance sheet.
Starbucks’ Intrinsic Value Using the Balance Sheet Elements
Intrinsic value formulas tied to the balance sheet rely greatly on several essential financial statement elements and certain business characteristics. The most important business characteristic is that the company has a strong portfolio of fixed assets that, in general, retain their cost value or the respective fair market value improves over time. Examples of companies with these characteristics include REITs, utilities, some manufacturing, and distributors. Starbucks does not have this business model. It relies heavily on leases and intangible items such as its brand. Thus, utilizing any adjustment for fair market value to balance sheet assets for intrinsic value is meritless.
Even without a step up of assets to fair market value, there are other intrinsic value balance sheet-based formulas. Another is book value. The problem with this formula is that the equity section of the balance sheet must have some positive value; Starbucks has a negative equity position. Look at this snippet from the January 2, 2022, SEC filing of the equity section of the balance sheet for Starbucks.
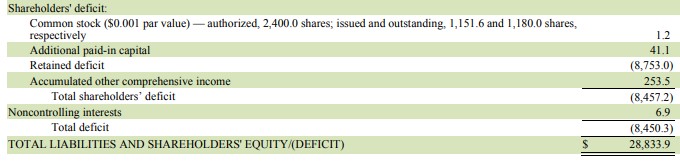
On January 2, 2022 (a little over a month ago at the creation of this article), Starbucks’ equity position was a negative $8.45 billion. For many value investors, this is a huge RED FLAG.
This eliminates the ability to use a very popular balance sheet intrinsic value formula, the book value. The result will be a negative $7.33 per share.
A third balance sheet intrinsic value is tied to the dividend. It is commonly referred to as the dividend yield. This is more effective with strong dividend-based operations (think of Coke, REITs, energy providers, and McDonald’s). Starbucks pays about 45 cents on the dollar of its earnings, which is generally higher than most large-cap companies but dramatically lower than the standard bearer, McDonald’s, in this industry. The current dividend yield is 2.1% which is not strong enough for a value investor. With an equity return requirement of no less than 5%, a $1.96 dividend payout per year is worth around $40 per share. And 5% includes limited risk exposure; with risk exposure, the desired return would have to be in the 7% range. Thus, at $1.96 dividend payout per year and a desired 7% return, a value investor would determine the intrinsic value to be around $28 per share.
Overall, with Starbucks, balance sheet-based intrinsic values are not viable to determine intrinsic value. A value investor needs to turn to the income statement-based formulas for an idea of value.
Starbucks’ Intrinsic Value Using Income Statement Elements
When looking at any company and determining intrinsic value, certain intrinsic value formulas are more reliable than others, depending on the company’s financial and industry model. There is no single universal intrinsic value formula that is superior. Every company has certain attributes that eliminate many of the intrinsic value formulas; thus, through attrition, the best formula remains. For Starbucks, the balance sheet formulas are inferior because the simple truth is that Starbucks is upside down; its assets are dramatically less in value than the liabilities recorded. To put it in layman’s business terms, the company is technically bankrupt (scholastic definition); there is no way it could pay its creditors if it closed up shop tomorrow. A third batch of intrinsic formulas focuses on the cash flow (discussed below). For brevity, none of the cash flow intrinsic value formulas apply to Starbucks’ situation either. Starbucks’ cash flow from operations is positive, but once you factor in free cash flow adjustments and the current liabilities increase, Starbucks’ cash flow isn’t really superior to earnings. Thus, only the second group of intrinsic values, income statement-based intrinsic value formulas, often referred to as earnings-based intrinsic value formulas, will provide a realistic idea of Starbucks’ overall market value.
There are three critical pieces of information required to evaluate the overall power of earnings related to any entity. The first piece is, of course, the company’s average earnings. The second part is commonly referred to as the discount rate, i.e., what is the risk factor associated with this company? The third and final element of the formula is the growth rate. All three elements impact the outcome of the result. The following subsections outline each of the three results.
Average Earnings
Defining average earnings is done in two different modes. The first and most common mode is as an absolute dollar value. This method is pretty straightforward: look back a few years at net profit, and then average this dollar amount to derive an absolute value. From above, looking back over four years and eliminating 2020’s result due to COVID, Starbucks’ average earnings per year were $3.8 billion. Many analysts have difficulty with using this because the further back one looks, the more likely the net profit was lower, and it weighs down the overall average. Thus, some analysts prefer to give more credibility to more recent earnings over earnings historically aged. Thus, if a value investor gives more credence to the more recent years over those further back in time, it should improve the average absolute dollar earnings per year. Using a basic sum of the years’ digits method (an accounting method that places greater emphasis on value to more recent or near future amounts over those further away in time), and looking back four years, the sum of the digits is 4 plus 3 plus 2 plus 1. Thus, the most recent year is worth 4 parts of the total sum of digits of 10. Therefore, 2021’s results are worth 4/10th’s, 2019 is worth 3/10th’s, 2018 is worth 2/10th’s and 2018 is worth 1/10th of the total. The outcome is as follows:
Year Net Profit Multiplier Weighted Portion
2021 $4,199.3 Million 40% $1,679,720,000
2019 $3,599.2 Million 30% 1,079,760,000
2018 $4,518.3 Million 20% 903,660,000
2017 $2,884.7 Million 10% 288,470,000
Totals $15,201.5 Million 100% $3,138,610,000
In general, weighting more recent results will make the outcome higher than the overall average. In this case, weighting more recent activity REDUCES the overall average annual earnings to $3.138 billion per year from the average of $3.8 billion. The detrimental earnings in 2019 (recall, COVID affected the entire economy starting in February 2020) greatly affected the method’s final result. In effect, because Starbucks lacks true consistency with its earnings, and it is not consistently improving from one year to the next, the overall average isn’t as reliable as the basis for an intrinsic value formula. A user of a formula should be cautious and give greater reliance on a more realistic average absolute net profit in dollars. In this case, the most likely absolute value is somewhere between the $3.138 billion and the average of $3.8 billion.
The second method is net profit as a percentage of sales. This method is easily derived by looking at the cumulative history of sales over a longer period of time, such as 10 years, along with total profit from 10 years, and calculating an average. This average percentage is then applied against the most recent quarter and then extrapolated for an entire year to determine the most likely profit in the current fiscal year.
During the last 10 years, Starbucks’ total sales (remember sales include licensee receipts and not their direct gross sales) were $211,263.5 Million ($211.3 Billion). Total profits during this same period equal $23,781 million ($23.8 billion). Thus, on average, Starbucks’ net profit margin is 11.25%. Using the most recent quarter ending January 2, 2022, as the starting point, sales were $8,050 million. Extrapolating for the entire year, it equals $32,200 million in sales for 2023. At 11.25% average net profit, Starbucks will earn about $3,622,500,000 ($3.6 billion). Just to illustrate Starbucks’ poor performance, sales during this past quarter ending January 2, 2022, were $8,050 million, and net profit was only $816 million; that’s a 10.13% net profit margin, and the 11.25% was the expected amount. Thus, Starbucks didn’t even match the historical average; it fell short by $89.6 million.
For the intrinsic value formula, a conservative earnings value is $3,138 million, a reasonable expectation is $3,623 million, and for a more liberal outcome, earnings are $3,800 million. These are the values for this element of the formula used further below.
Risk Factor
The risk factor is the second element in the intrinsic value formula for earnings. This formula uses the standard discounted earnings financial function, whereby earnings are discounted based on a risk factor over an extended period of time (25 to 30 years) and summed to a cumulative total current value. For those of you unfamiliar with this basic banking formula, the further out in time earnings are discounted, the more dramatically less is the outcome than the current year’s earnings. Simply stated, the value of one dollar is worth a lot less today the further out one receives that dollar; in effect, inflation and opportunity affect its value. In addition, the stronger the discount rate, the greater the reduction in value is applied against that dollar over time.
There are four key parts of determining risk factors. They are as follows:
- Risk-Free Rate – This is the rate that exists with Treasury notes. It is what most investors will accept without any risk.
- Equity Risk Rate – A rate an investor is willing to accept given the position they fall within the spectrum of ownership rights, i.e., equity positions range from 4% to as high as 7%. Bondholders are in the 3% to 5% range. Secured bondholders have less risk involved and are in the 2.7% to 3.5% range.
- Size Premium – An additional 1% to 4% depending on the size of the company. For example, Walmart’s size premium is around 1%. Mid-Cap investments are in the 2% to 3% range, whereas penny stocks are slightly more than 4% premium.
- Specific Risk – A factor associated with the purpose of the investment and the ability to sell the respective investments promptly. In this case, Starbucks is stable, and it is easy to dispose of a stock position with Starbucks. A bond position would require a higher specific risk. Overall, specific risk ranges from 0% (McDonald’s stock position) to as high as 4% for an over-the-counter stock purchase.
For Starbucks, the risk outcomes are as follows:
- The risk-free rate is 2.25%.
- Equity risk for Starbucks is much higher than McDonald’s due to the lack of highly stable earnings; if you review its historical earnings, it isn’t considered highly stable, and it is heavily reliant on international sales; thus, a 6 to 6.75% risk factor is applicable here. For this analysis, 6.5% is used.
- Size Premium – Starbucks is considered a large-cap investment; thus, a 1.25% size factor is warranted.
- Specific Risk – The purpose of this investment isn’t to hold the stock nor reap dividends; the purpose is to sell it high upon market recovery. There can be several reasons that Starbucks’ market value will decrease below its intrinsic value; most of these reasons are long-term in nature, such as lack of supply, international politics, a negative equity position on the balance sheet, and many more. Thus, the specific risk is going to be higher than McDonald’s at zero. For this calculation, a 1.25% specific risk factor is reasonable.
The total discount factor is 11.25% which is typically higher than other companies in the S&P 500 with this level of sales and profitability. As a comparison, McDonald’s is less than 8.25%.
Growth Rate
With business, growth is a function of the number of locations and the volume of sales per location. Sales can be further broken down into the growth in the number of items purchased per ticket and, of course, the growth in sales value per item. Your common novice investor will think that inflation is the number one driver of growth; the reality is starkly different. Growth is mostly driven by the ability to expand into new territories and broaden the product line, along with increasing the efficiency of existing locations. Think of how a retail outlet can get more people through the line faster, in effect, faster service.
Starbucks’ growth over the last 13 years has been driven by the number of locations throughout the world. On January 1, 2009 (13 years ago), Starbucks had 16,930 stores. At the end of the most recent fiscal year, Starbucks had grown to 33,850; that is almost double from 13 years ago. This means Starbucks’ growth rate is driven by the 5.5% growth rate in the number of stores. The overall financial growth rate is about 7.1% per year. Thus, about 75% of the growth is driven by expansion, and 25% of the financial growth is driven by increased sales per store, some of which is a function of inflation.
When determining a growth rate, the key is to determine if the growth rate can be maintained. Is Starbucks’ expansion rate going to remain at 5.5%? Over the last four years, Starbucks has had an average expansion rate of 4.3%. Thus, Starbucks is beginning to slow down its expansion rate. If expansion is 75% of the average growth rate, then Starbucks’ actual growth rate is approximately 5.75%. This is significantly slower than the 7.1% historical average experienced over the last 13 years. Thus, a growth rate of 5.75% to 6.1% is an acceptable range for Starbucks with the intrinsic value formula.
Intrinsic Value Formula Based on Earnings, Discount Rate, and Growth
The discounted earnings approach is exercised across three different models – conservative, reasonable, and liberal approaches. The approaches vary using the three different earning levels as identified above. In addition, the discount rate will vary by about .25% on either side of the pre-calculated rate of 11.25%. The store’s growth rate varies around the 5.9% point, which is considered a reasonable expected level of growth over an extended time period. The outcomes are as follows:
Conservative Approach
Using an average earnings of $3,138 Million per year (the value determined using the sum of the years’ digits method) with a discount rate of 11.5% (.25% stronger than the reasonable determined amount of 11.25%) and a slower growth rate within the range from above of 5.75%, total market value of Starbucks equals $44,001 Million ($44 Billion). This equates to $37.42 per share.
Reasonable Approach
Using $3,623 million as the average earnings with a discount rate of 11.25% and a growth rate of 5.9%, the total market value of future earnings equals $53,024 million or around $45.09/share.
Liberal Approach
Using $3,800 million as the starting average for earnings and a lower discount rate of 11% with a slightly stronger growth rate of 6.1%, the total market value of future earnings is about $58,402 million or around $49.67/share.
Under the three different approaches, intrinsic value ranges from a conservative estimate of $38 per share to a liberal estimate of $50 per share. A reasonable outcome places the intrinsic value at about $45 per share.
Starbucks’ Intrinsic Value Using Cash Flows Statement Elements
The intrinsic value formula using cash flows as the basis for intrinsic value calculations is predicated on one primary requirement: there must be some form of terminal value tied to existing assets of the entity at the end of a reasonable period, such as 25 or 30 years out. The simple reality is that Starbucks does not qualify for this. Its physical assets will be some warehouses they currently use for distribution purposes. Thus, unlike fixed asset-intensive operations, the discounted cash flows method will have a very small value for terminal value, and in reality, given the negative equity position of this company, it may have to pay money if it were terminated in 25 to 30 years. Furthermore, most of its value is tied to one real aspect of business, selling coffee. It only works if it is an ongoing concern, not an entity that requires strong cash outlays each year to maintain its existing assets. The cash outlay each year funds growth with the continued expansion of corporate locations.
Therefore, any form of a cash flows intrinsic value method will either end up with a lower outcome than the earnings method above or produce unreliable results.
Intrinsic Value for Value Investing (Summary)
Intrinsic value calculations are heavily reliant on the ability to predict the future based on the past. The more common risks of consumer demand, legal issues, employee development, and expansion are reduced or included with the outcome due to reliance on an extensive past of information. However, intrinsic value can not take into consideration those risks that are unusual, infrequent, or may remotely exist. With many companies, these are not obvious. However, with Starbucks, this does exist. Starbucks even states this in their annual reports. Go to pages 11 and 12 of the 2021 Annual Report. It lists certain macroeconomic risks that are important to include when assessing their impact. For this article, there are two:
- Starbucks sells ARABICA coffee; for those of you unaware, arabica coffee can only be grown in a very narrow band spanning the globe. It is grown in a hilly or mountainous zone with proper amounts of rainfall, warming and cooling extremes, and requires manual labor to harvest the beans. Unlike beef, where cattle can be raised just about anywhere, arabica beans have a limited footprint of possible growth area on this planet. As Starbucks puts it:
The availability and prices of coffee beans and other commodities are subject to significant volatility. We purchase, roast, and sell high-quality whole bean arabica
coffee beans and related coffee products. The high-quality arabica coffee of the quality we seek tends to trade on a negotiated basis at a premium above the “C”
price. … The supply and price of coffee we purchase can also be affected by multiple factors in the producing countries, such as weather, climate change, water supply
quality and availability throughout the coffee production chain, natural disasters, crop disease and pests, general increase in farm inputs and costs of production,
inventory levels, political and economic conditions and the actions of certain organizations and associations that have historically attempted to influence prices of
green coffee through agreements establishing export quotas or by restricting coffee supplies. Speculative trading in coffee commodities can also influence coffee
prices. For example, drought conditions in Brazil have and, given continued drought conditions, are predicted to continue to impact coffee prices. - Starbucks relies heavily on sales from two countries with opposing views on the world order – the U.S. and China. At some point in the future, there will be some form of a possible military encounter, which in turn will cause China to possibly disallow U.S.-based investments to continue operations in China. Per Starbucks’ annual 2021 report:
… especially in our largest markets, including the U.S. and China, labor discord or disruption, geopolitical events, war, terrorism (including incidents
targeting us), political instability, acts of public violence, boycotts, increasing anti-American sentiment in certain markets, hostilities, and social unrest, and
other health pandemics that lead to avoidance of public places or restrictions on public gatherings, such as in our stores.
These two risk factors are not built into the intrinsic value formula and, as such, should be taken into consideration when developing the buy price for Starbucks. The exposure of these two risks should add a lot of caution for value investors, such that the margin of safety for Starbucks should exceed 20% of the reasonable intrinsic value formula outcome of $45 per share. For this article, the current buy price for Starbucks with this Fund is set at $33, which is a 26.6% discount against the intrinsic value. It is one of the strongest margins of safety that exists in the entire portfolio of potential investments.
Using reasonable elements for the discounted earnings formula as follows:
- A reasonable average earnings per year of $3.6 billion;
- A discount rate of 11.25% tied to the following negative financial characteristics of Starbucks
- Negative book value,
- Board of Directors’ poor decision to repurchase shares at high market prices when the company has a negative equity position,
- 5400 stores in China,
- Long-term debt and leases exceed corresponding assets by $8.3 billion (three years of earnings);
- A growth rate of 5.9%;
Starbucks’ intrinsic value is approximately $45 per share. Any investor should err towards a more cautious approach given all the existing negative characteristics and potential dramatic, unusual risk factors this company is exposed to in the world economy. Furthermore, the Board of Directors is not acting wisely when they allow the company to use its cash to the tune of $3.5 billion to buy back stock at extreme market prices (estimated at over $110/share). Simply stated, Starbucks’ current market price is so overvalued and at such a high risk of falling quickly to a very low price (like in the teens); it is wise for a value investor to just let that happen and purchase this company at a super low price when it does. Act on Knowledge.