
Union Pacific – Buy/Sell Model
Union Pacific carries the highest price-to-book ratio among the five Class I Railways. It is about a 1.43 times factor over the next best price to book ratio of CSX at 4.73. Here are the current price-to-book ratios as of closing on October 22, 2019:
October 22, 2019
. Market Price Book Value Price to Book
Union Pacific $170.46 $25.13 6.78
CSX $71.80 $15.18 4.73
Canadian National $88.99 $25.66 3.46
Norfolk Southern $187.54 $57.65 3.25
Canadian Pacific $219.37 $52.02 4.21
Kansas City Southern $145.11 $49.89 2.91
In the prior article addressing opportunities with railroads, it was explained how to build a model to buy and sell stock for Kansas City Southern (KSU). Take note, Union Pacific’s price-to-book ratio is 2.33 times that of Kansas City Southern. This means the buy/sell model is also different; it is almost the exact opposite of KSU’s model. In KSU’s model, the investor looks for an opportunity when the price slips more than 5% and then sells once the stock recovers about 12%. With Union Pacific, the investor gets value by waiting for the price to dramatically decrease. I’m talking about more than 15% decreases. Gains are earned once the stock recovers almost to the prior peak. This peak-to-peak model takes much longer to cycle through with high price-to-book ratio investments, but the reward is worth the wait.
Let’s illustrate by first displaying the last five years of cycling of Union’s stock price. Look at this graph.
Three cycles fit this particular set of criteria. On Sept 17, 2018, the price peaks at $164.19. Now the wait begins. Using a 10% decrease, the price drops to $147.77 on 10/22/18. Assuming each share costs $1.00 to buy and the investor spends $1,000, the investor buys 6.7217 shares.
Follow the graph line and you’ll see the price recovers to the peak of $164.19 on 02/12/19. On this day, the investor sells and receives $163.19 per share after costs of $1.00 per share. Total amount received equals $1,096.91. Return on the investment after costs is $96.91, and the money was tied up for 114 days. If this is annualized, the yield equals 30.94%.
However, take a look at the gap from February of 2015 to December of 2107. If you follow the criteria for this down/up cycle, you get the following:
Buy: On 02/17/15, the stock price peaks at $123.66. A 10% decrease is $111.29, which happens on 05/11/15. With a $1,000 investment and a transaction fee of $1 per share, the investor buys 8.9055 shares.
Sell: The stock recovers back to $123.66 on 11/27/17, taking 1,014 days to cycle. Dollar yield equals $92.35, interest yield equals 3.325% per year.
As a value investor, that type of yield isn’t going to cut it in terms of a good return on the investment. Naturally, there is a dividend yield too. If you figure 1.5% per year, the total average annual yield totals 4.8%. This is still not a good return on the investment. So how can the model be improved?
To develop a good model, the reader needs to understand why the down aspect of the cycle is where the real value is earned. Unlike KSU’s model, where the down point to buy is 5% less than the peak, with Union Pacific, the down point must be greater. In addition, another section explains that buying in a down cycle more than once is also lucrative to the investor. Finally, the selling point is set and the corresponding results are calculated. The result is a model that earns a good return for a high price-to-book ratio investment.
The Down Cycle with High Price to Book Ratio Stocks
As explained in my article, High Price to Book Ratios – Proper Interpretation and Evaluation, strong price to book ratio investments infrequently have deep or extended price depressions. When they do, investors must take advantage of these opportunities. Union Pacific’s financial performance is superior to its comparable competition. To illustrate Union’s financial performance, compare Union to another railroad stock with a similar book value. Let’s see how Union delivers financial performance in comparison.
. Union Pacific Canadian National*
Book Value $25.13 $25.66
EBITDA (Last 5 Yrs Total) $50.92B $41.50B
Operating Cash Flow (Last 5 Yrs Total) $38.18B $33.96B
Earnings/Share (Last 5 Yrs Total) $37.58 $33.77
Dividends/Share (Last 5 Yrs Total) $11.46 $9.38
Gross Margin % (Last 5 Yrs Total) 41.43% 46.65%
*I used a multiplying factor of 1.298 to convert Canadian Dollars to US Dollars.
Even with a better gross margin percentage and similar book value, Canadian National can not beat Union Pacific in every value-driven row. Union Pacific’s earnings before interest, taxes, depreciation, and amortization (EBITDA) are almost $10 billion more over 5 years than Canadian National, which results in more operating cash flow, earnings per share, and the ability to pay out greater dividends to the shareholders. The result is exactly similar to all high price-to-book ratio stocks; this greater stability results in a much greater price-to-book ratio. Union Pacific’s ratio is almost twice that of Canadian National.
With this knowledge, the investor must use the market’s forces that drive the share price. In general, Union Pacific’s stability makes it the default leader in the railroad industry. Therefore, deep downturns in stock price will be infrequent and shallow. The market will naturally want to buy the stock as its price decreases due to the historical stability. Remember, the bulk of the market buyers are institutional, and this company provides all the positive criteria investors want – stability and yield. As the share price decreases, the yield increases, making the stock more attractive to institutional buyers.
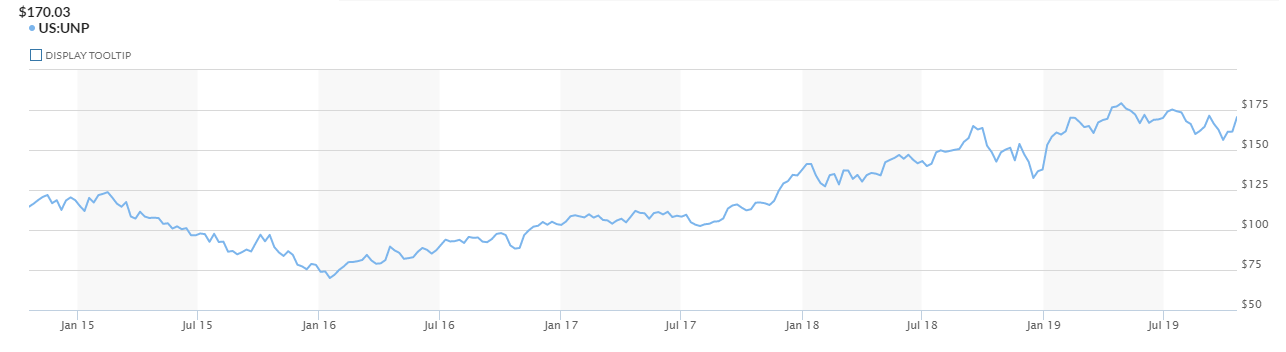
Let’s look at the historical share price for Union Pacific over a ten year period.
Look at the line; it generally has an upward incline. There were only three times in the last ten years when the share price decreased by more than 15%. They are as follows:
- On 06/26/11, the stock price peaked at $53.38, and then on 09/25/11 (three months later) it dipped to $40.84, a 23.5% decrease.
- On 02/15/15, the price again peaked at $123.83 and slid downward to $69.99 on 01/17/16, a whopping 43.4% decrease.
- On 09/16/18, the price again peaks at $164.99 and drops to $132.54 on 12/16/18, a 19.7% decrease.
There are many downward changes, but the key to high price-to-book value stocks is finding deep and/or long depressions in the share price. If you buy the stock early on in the depression side of the price change, you extend the period of holding the stock to recover your investment, thus significantly reducing your yield. You must be patient (again, patience is the key to value investing).
Recall, high price-to-book ratio stocks are generally more stable than other stocks. Therefore, share price depressions are infrequent. Union Pacific has had three in 10 years! But when it does happen, you must take advantage and buy. For my model, I am setting my target depression at 17% of the prior peak. As of today, 11/17/19, the prior peak is $177.77 on 11/05/19. Therefore, it is unlikely that Union is a target for the railroad fund anytime soon. I must be patient and wait for the price to significantly decrease. It will happen, I may have to wait upwards of three years, but it will happen, and when it does, I will do well when it rebounds.
My target trigger for the next buy with Union is $147.55.
This leaves me two issues to resolve. One, what is my selling point? Two, and the above chart bears this out, do I buy more shares if the stock continues to decline, i.e., buy more shares during long and deep depressions in the share price?
Union Pacific – Long Deep Stock Depressions
Look at the large downward depression that occurs during all of 2105 and into 2016. Using my parameters set for the buy trigger, I would have bought stock on 05/13/15 when the price hit $102.64, which is the 17% requirement from $123.66 on 02/15/15. However, the stock continues to decline for the next seven months, reaching the low point of $69.99 on 01/17/16. The question is, does an investor continue to buy more stock?
Look at the history, the stock does recover; it always recovers. It’s just a matter of time.
With this site’s value investment model, it is going to continue using 17% depressions as buy points. Here is the chart of triggers of 17% decreases starting with the stock peak point and the point resets to the most recent buy point.
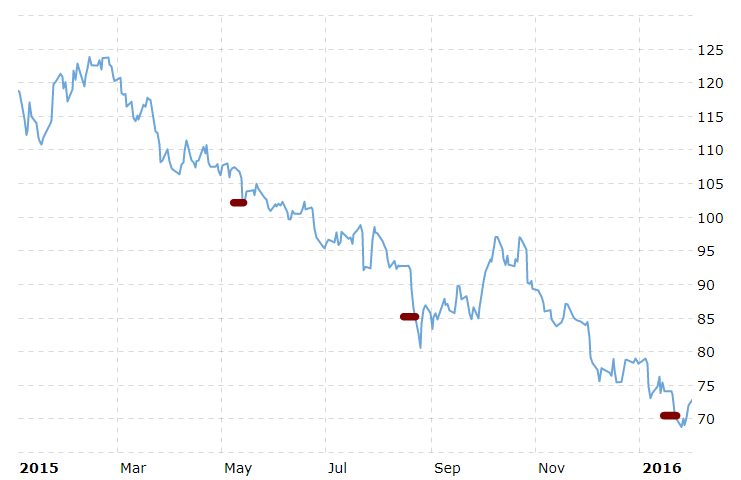
There are three points of buy triggers. The first one occurs on 05/13/15 when the first 17% decrease from the peak happens. The fund buys at $102.64. The next buy point must be 17% lower than this buy point. This happens again on 08/24/15 when the price hits $85.19, which is 83% of $102.64 (1 – .17% = 83%). The final one in this long downturn occurs on 01/21/16 when the price hits $70.71. Note how the price continues to decline even after the buy in January 2016. It bottoms out in this cycle at $68.79.
Now the question is: ‘When do I sell?’
Union Pacific – Setting the Sell Point
When to sell has perplexed investors for eons. I have reiterated over and over again the fact that high price to book value stocks always recover from stock declines. In reality, they generally recover faster than other stocks because of stability. Again, there is a lot of trust in a high price to book stock from investors. It is just a matter of time before it recovers. Look at Union’s 39-year history of the share price recovering.
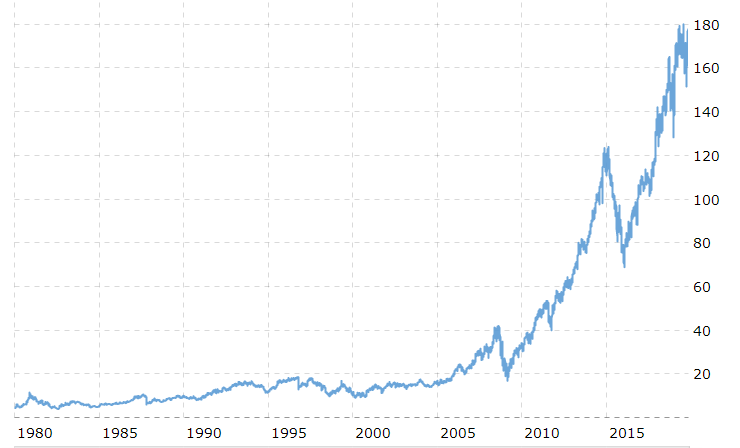
First, note that all decreases have fully recovered over the last 39 years. In actuality, it’s been doing this over the lifetime of Union Pacific. For the investor, the problem is the duration to recover. The longer the recovery, the lower the yield for a value investor. At the same time, it will recover. As an investor, you have to weigh the natural long-term return on the investment against the ability to exercise the investment and sell high and reinvest in something else that is a good buy. This still doesn’t answer the question: when is a good selling point?
During the last 39 years, there have been a couple of long-duration recovery periods. From a peak in October 1996 at $18.59, it had a sudden dip to $12.84 in one day. It took nine years to recover. The investor would have made a 44.7% return on the investment, but it took nine years, which means the yearly yield average is less than 6% including dividends. This isn’t value investing, it’s long-term investing, i.e., a hold concept strictly for dividend yield.
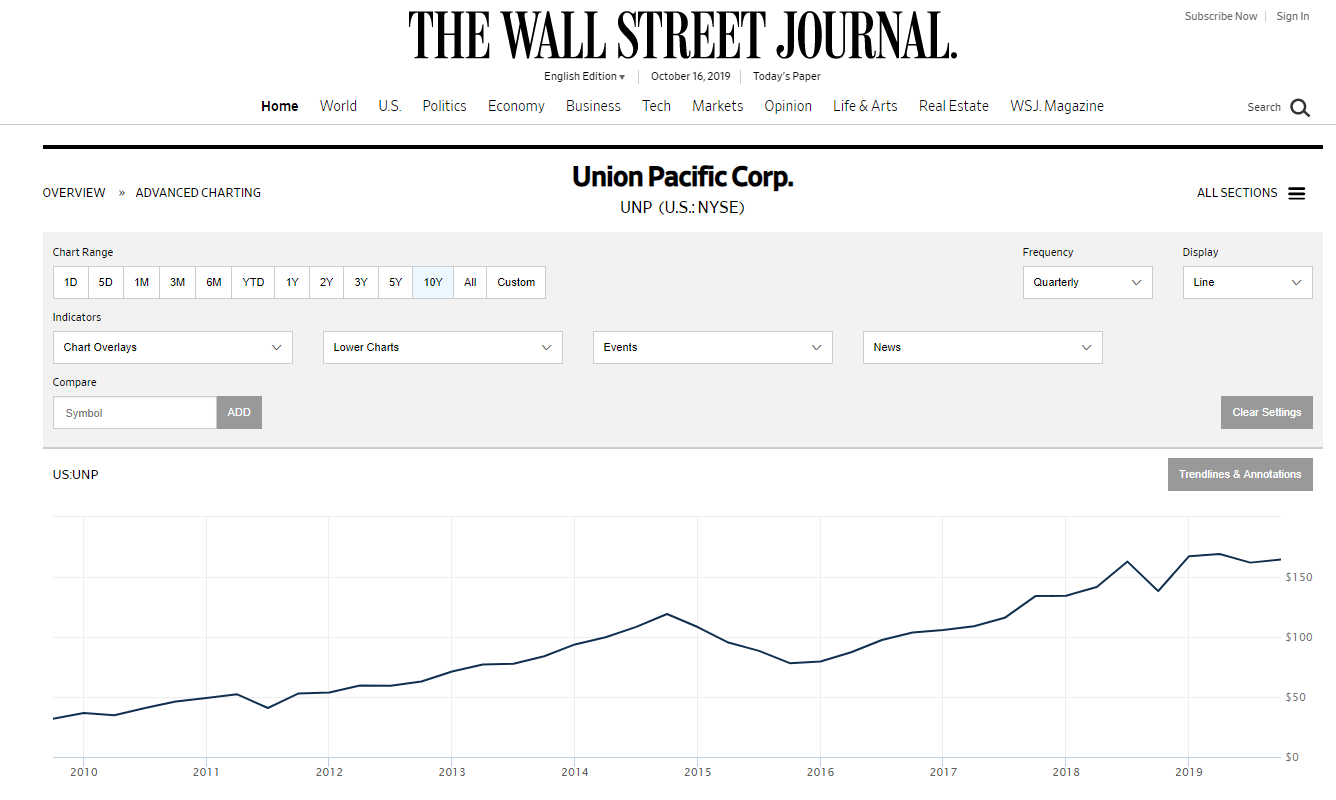
So when do you sell? Looking at the long-term recovery period of 1994 through 2003, the investor can see that the share price does go through several iterations of recovery to a reasonable original peak. Look at this graph of this period for the share price.
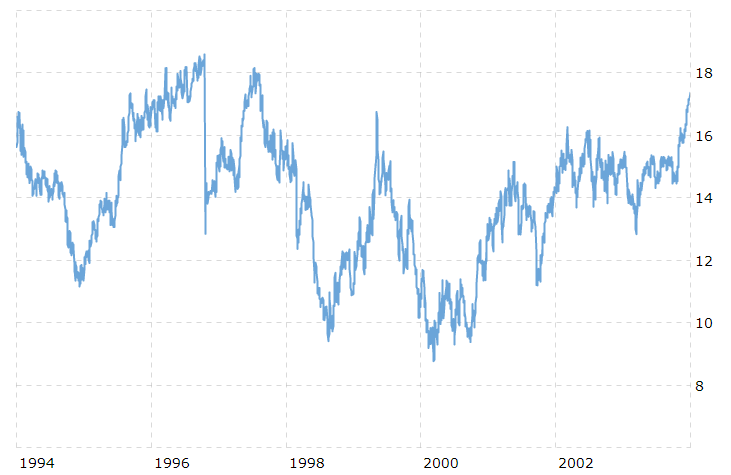
The share price peaks in October 1996 and dips in one day $12.84. Notice there is a recovery to $18.16 on 07/11/1997. Then the stock dips again and has different recoveries and dips over the next 7 years. What is interesting is that the stock does recover multiple times in a short duration of time. I did not research the price-to-book value for this period. During the last five years, under the high price-to-book value, there was a three-year period for the stock price to recover 100%. Look at the first chart above. From Jan of 2015 to November 2017, the share price cycles. This is 34 months long.
Tying up money in an investment with such a potentially long recovery cycle doesn’t seem prudent; it reduces the yield. But value investing is about patience, and not about increasing risk for potential sudden gains. Thus, I’m going to start my model with the old 80/20 rule. I want to sell when I’ve earned 80% of the prior change. Thus, for any buy at a 17% dip in price, it means that the model sells once it recovers 80% of that change. This result is when the price is 96.6% of the original peak, the fund sells the stock and takes its gains. Here’s the math:
Peak Price $1.00
Buy Price $.83
Recapture Price = 80% of the recovery of the 17% decrease, which = 13.6 cents per dollar, which nets to 96.6 cents on the peak price.
Let’s look at the results for the respective buys over the last 10 years.
Results
During the last 10-year period, there were five buys. Up in the second chart, I identify three buy points. The middle one has three purchases, including the primary purchase related to the change. Remember, the model buys when there is another 17% dip in share price. In the table below, the gain is net of $1 transaction fees for both the buy and sell of each share. The net gain and the number of days held are included. The final column identifies the annual yield. The table does not include dividends received during the holding period.
Deal # Date Prior Peak Buy Price Sell Price Gain # of Days Held Annual Yield
1 08/08/2011 $53.38 $44.31 $51.57
1 12/05/2011 $51.57 $5.26 120 35.2%
2 05/13/15 $123.83 $102.78 $119.62
2 11/29/17 $119.62 $14.84 929 5.81%
3 08/24/15 $102.78 $85.31 $99.29
3 11/18/16 $99.29 $11.98 451 9.67%
4 01/21/16 $85.31 $70.81 $82.41
4 03/18/16 $82.41 $9.60 58 60.25%
5 12/19/18 $164.99 $138.60 $159.38
5 01/25/19 $159.38 $18.78 37 184.75%
This model indicates success given the parameters set. Interestingly enough, it does not include dividends, especially dividends during the long hold periods involved with deals 1, 2, and 3. I would imagine that dividends would have added 2% to the annual yield value for deals 2 and 3.
The results reinforce the value investing concept of patience. Furthermore, it validates incremental buying during the long downward depressions in stock price; see deals 3 and 4 outcomes.
Summary
Union Pacific is a high price-to-book-value investment. Given the history of the share price, recovery will happen. In general, an investor must be patient and wait for a minimum of a 17% decrease from a prior peak price to buy stock. Once held, patience again is required. Once the share price has recovered to 96.6% of the original peak, it is time to sell and take your gains. You can continue to wait; history demonstrates full recovery plus more. Yield results will vary. Given the results over the last 40 years, I have set the fund’s parameters to capture the gains and move on to the next opportunity. With Union Pacific, opportunities will be few and far between over a long period. But when it happens, the results are impressive. Act on Knowledge.