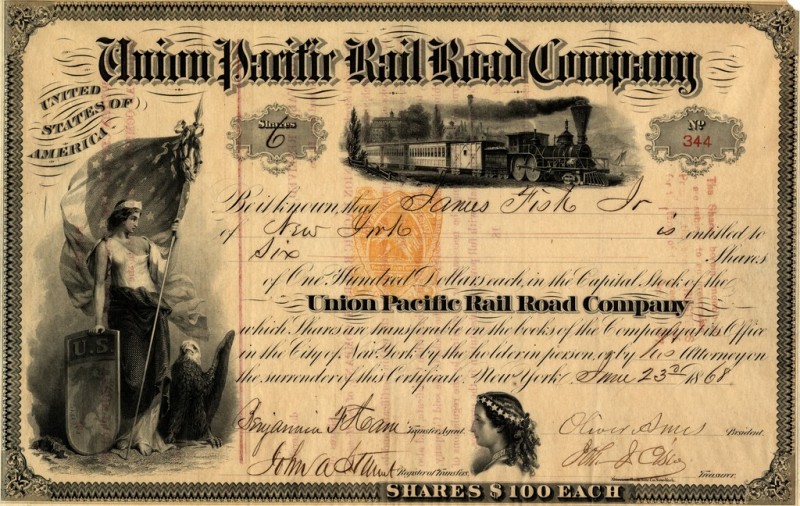
Union Pacific – Performance Evaluation of 2020
 Union Pacific (UP), a Utah corporation, is the largest of the six publicly traded Class I Railways operating in North America. Union Pacific is the standard bearer of performance, especially since UP has a high price-to-book ratio in comparison to the other five railroad stocks. From High Price to Book Ratios – Proper Interpretation and Evaluation, the key driver of stock price is the stability (consistent performance year after year) of earnings. Shareholders have little tolerance for management if the company underperforms. Historically, UP is considered highly stable for the railroad industry.
All of the following analyses, evaluations, and opinions that follow stem from the Union’s annual report filed with the Securities and Exchange Commission. For those of you who want a copy to use as a reference, download it here: UP’s Form 10-K for 2020.
This evaluation is divided into four sections:
- Historical Perspective
- Operational Performance
- Financial Results
- Insights
This performance evaluation starts with a historical perspective.
Union Pacific – History of Performance
UP operates in 23 states, Canada, and Mexico. UP owns 26,100 miles of track linking the Gulf Coast to the West Coast and has access to another 25,600 miles of track. Furthermore, the company owns and leases 7,600 locomotives and 52,900 freight cars. The company is really a combination of mergers of seven railroads over the years. Union Pacific started out as a chartered company from the Pacific Railway Act of 1862 advocated and signed by Abraham Lincoln.
 In 1869, Union Pacific met Central Pacific at Promontory Summit in Utah to complete the transcontinental railroad. In 1880, the mergers began when Kansas Pacific and Denver Pacific joined under Union Pacific to broadly expand the railroad under one umbrella.
Other mergers built Union Pacific over the next 110 years:
- 1901 – Southern Pacific Railroad
- 1982 – Missouri & Western Pacific Railroad
- 1995 – Chicago and Northwestern Acquisition
Today, Union Pacific is the largest publicly traded market capitalization railway in the world. Its revenues are almost one-third of all Class I Railways in North America. What is most impressive about their record is that the railroad has paid dividends for 121 years in a row. It is referred to as the ‘Grand Daddy’ of railroads, given its history and industry position.
The company focuses on three groups of commodities as follows:
- Bulk – 33% of the revenue
- Industrial – 36% of the revenue
- Premium – 31% of the revenue
The number one metric to measure a railroad company is revenue ton miles, which are the total miles of hauled freight. A secondary measure is dwell time, and a tertiary measure of performance is the operating ratio (costs of hauling as a percentage of revenue). Here is a table of the last six years:
Metric 2020 2019 2018 2017 2016 2015
Revenue Ton-Miles (Billions) 385.0 423.4 474.0 466.7 440.1 485.0
Dwell Time (Hours) 22.7 24.8 29.8 30.3 28.1 29.3
Operating Ratio 59.9 60.6 62.7 62.0 63.5 63.1
For comparison purposes, here are four of the other five publicly traded Class I Railways’ revenue ton-miles (Billions):
Name 2020 2019 2018 2017 2016
Canadian Pacific 151.9 154.4 154.2 142.5 135.9
Norfolk Southern Unavailable 194 207 201 191
CSX 182.6 196 202.9 196.1 Unavailable
Canadian National 230.4 241.9 248.4 237.1 214.4
Union Pacific has 60% more volume than the next closest competitor. The only concerning issue here is the overall drop in revenue ton-miles during the last five years. It would be prudent for an investor to monitor current operational performance indicators (key performance indicators).
Union Pacific – Operational Performance
Interestingly, UP doesn’t report revenue ton miles except annually. During interim accounting periods, UP reports the number of cars moved. In general, there is a high correlation between the number of cars moved and revenue ton miles. The correlation ranges from .94 to 1.06. Thus, it is a very reliable key performance indicator for success. Through March 14th, 2020, UP has moved 1,651,399 carloads. They are 8% behind this point in 2019, 1,798,236 carloads. This trend existed before the coronavirus market adjustment. It looks like during the early stages of this market, UP’s performance hasn’t been impacted yet.
Union Pacific – Financial Results
All three commodity groups saw at least 9% decreases on average in revenues during 2020, tied to the slowing of the economy driven by the pandemic.
