
Market Fluctuations (Lesson 3)

“Look at market fluctuations as your friend rather than your enemy; profit from folly rather than participate in it” – Warren Buffett.
The prima facie tenet of value investing is to buy low and sell high. In order for this to happen, the respective targeted stocks, those within the pools created, must have price changes. In business, well-run companies have a continuously increasing stock price driven by ever-increasing profits. As profits rise, so does the stock price. One of the best examples is Coca-Cola. Look at Coke’s stock price for the last 58 years.
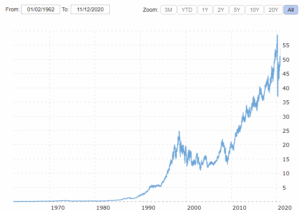
Coca-Cola is considered one of the best-performing companies over its lifetime. If you had purchased $50 worth of stock in 1919, it would be worth over $20 million today.
Coca-Cola is one of the DOW Jones Industrial Average companies (top 30) today and has been for almost 40 years. Thus, it is expected for it to earn good profits and be a sound, well-run organization; review Lesson 2.
This particular trend line of Coke’s stock price mirrors the DOW Jones Industrial Average over a similar timeline. And you’ll discover that the large capitalization market companies combined have a similar line also. Thus, in general, quality stocks continue in an upward trend.
If this is true, how can a value investor make money? Go back to the prima facie tenet of business: ‘Buy Low, Sell High’. The idea is to create a pool of similar stocks, about 4 to 8 stocks of companies with similar characteristics and financial dominion. Do some research, analysis, and create financial metrics. This provides the value investor with the confidence to set the buy and sell prices for each company within the pool.
Now it is just a matter of waiting for the fluctuations to occur. How do they occur, though?
Every company, industry, sector, and the economy as a whole experiences fluctuations in their respective values in the market. They happen daily. Some are economy-wide, others are tied to just the company. Maybe a bad quarterly report drives existing holders of stock to sell, thus discounting the price. If performance is well off the norm, the discount could be rather deep, and now opportunity for value investors to buy.
Let’s go back to Coke. Let’s assume that a value investor determines that a 12% discount in the share price from a prior high warrants ownership of the stock. Take a look at Coke’s last ten years.
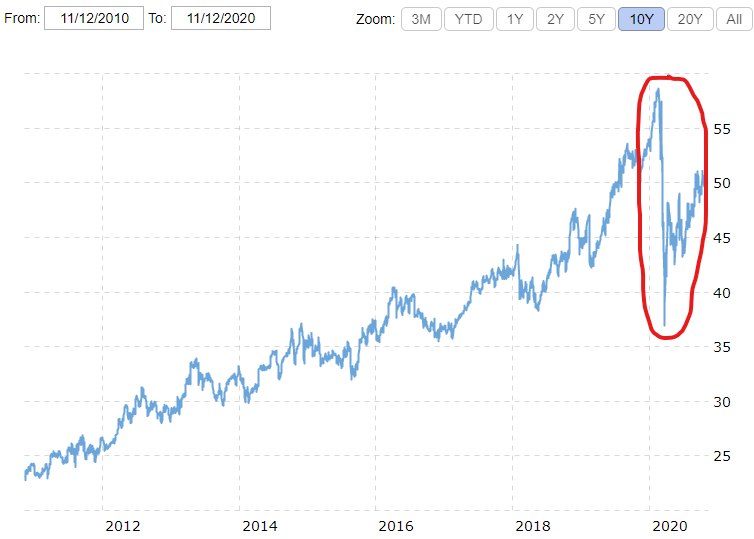
If you review all those ups and downs over the last 10 years, only once has Coke had a downward share price fluctuation greater than 12%. This, of course, was tied to the huge market decline in the late February – March 2020 time frame due to the COVID pandemic. Unfortunately, all companies were experiencing this sudden downward change.
This just illustrates the strong loyalty consumers and shareholders have to Coke. Coke is not an ideal candidate for value investors only because it is difficult to find market price declines with deep discounts that value investors seek.
Now, let’s do the same thing with another DOW Jones company – Caterpillar.
The second most lucrative export of the United States is heavy equipment. Caterpillar has sales in the range of $35 billion to $65 billion per year over the last ten years. Since sales fluctuate greatly, so does the stock price. Take a look at Caterpillar’s stock price over the last ten years.
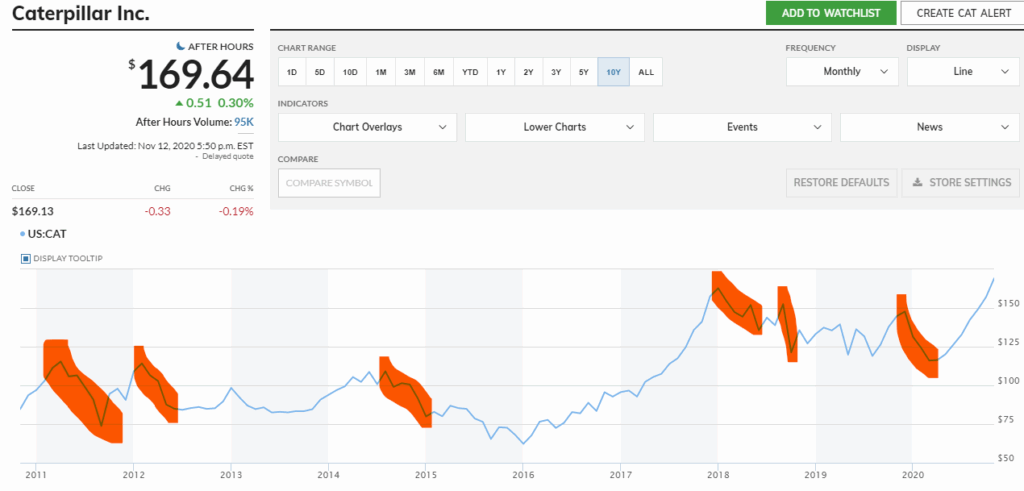
After careful evaluation and analysis, let’s assume the value investor wants a minimum 14% decline in the share price before purchasing. In this case, there are six occurrences over the last ten years (highlighted in orange).
Caterpillar does have more frequent significant (>3%) fluctuations than Coke, and these are driven by both political and interest rate factors. However, Caterpillar is still not an ideal value investor stock because of how long it takes to recover. It does recover, but this extended time frame just reduces the effective annual return on the investment. But the point here is that market fluctuations do occur, and this is what value investors seek.
The key is to find market fluctuations that occur frequently and include both declines and recoveries for the respective stocks within the pool.
Here is an example of a large-cap stock from the railways pool of the Value Investment Fund (access to its data requires membership in the Value Investment Club on this website).
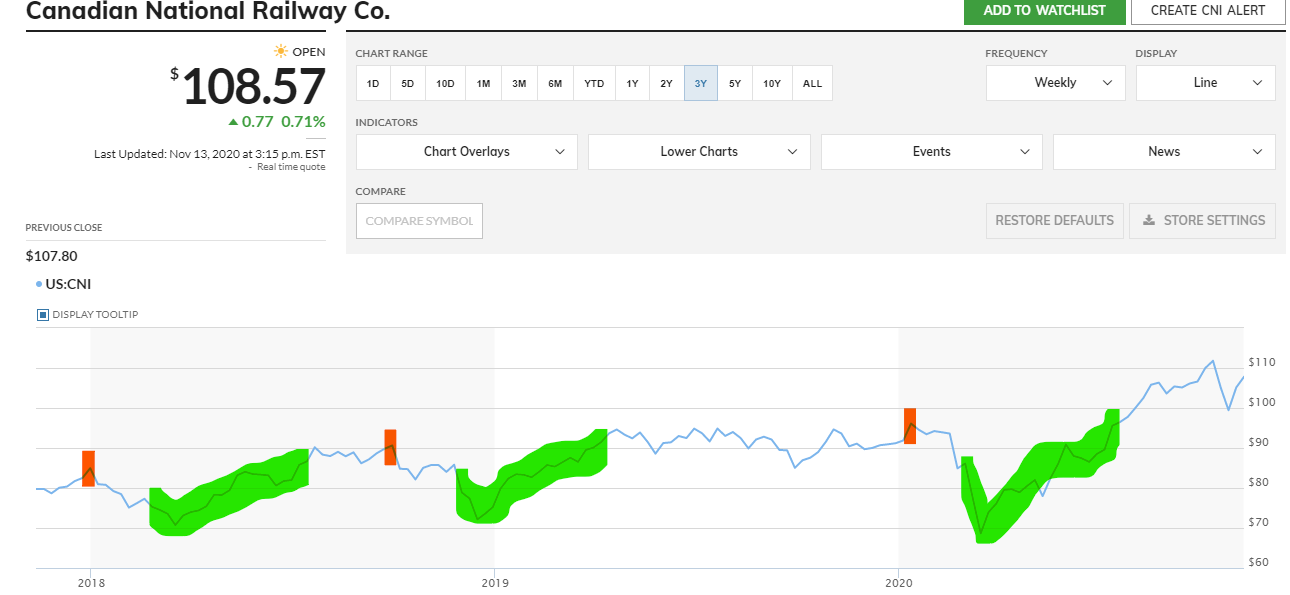
This is the Canadian National Railroad’s stock price over the last three years. The orange marks represent prior peaks in the stock price. This particular set of buy/sell triggers is 12% discounts from prior peaks and sells upon reaching back to the prior peak. Thus, the first cycle illustrates a prior peak price of $84.99 with a buy price of $74.79 occurring on 03/04/2018. On 07/08/2018, the stock price recovers. Thus, the gain on the sale equals $10.20 on an investment of $74.79 or a 13.64% return over four months. The annualized return is approximately 40%.
This happens about once a year. Here is the chart of respective dates and amounts with the return on the investment along with the annualized return.
Prior Peak Date $ Amount 12% Discount Date Buy Amount Sell Date $Gain Effective Return Annualized Return
12/31/2017 84.99 03/04/2018 $74.79 07/08/2018 10.20 13.64% 40.03%
09/30/2018 90.63 11/25/2018 $79.75 04/07/2019 10.87 13.63% 29.17%
01/12/2020 96.10 03/01/2020 $84.57 07/26/2020 11.53 13.63% 28.16%
The effective return will always be 13.63% with a discount buy rate of 12%. The annualized return is tied to the number of days for the price to recover. The shorter the period, the higher the annualized return rate. The key to this table is that this particular stock recovers quickly, and therefore, the annualized return is outstanding. This particular company’s share price experiences this cycle about once a year. Thus, it is a reliable investment in the Railways Pool of the Investment Fund.
Recognizing fluctuation patterns with high-quality stocks is a part of the process for value investors. This is taught in the development part (Phase Two) of the membership program. For the reader, the key point is that fluctuations are essential for value investing to work.
Market Fluctuations – Economic Driven
As stated earlier, market fluctuations are driven by three different forces. The one most commonly recognized by all is the economic-wide drivers. If you look at Canadian National’s graph above, the early period of 2020 is a reflection of the big market decline driven by COVID-19 restrictions during the first quarter of 2020. Thus, market-wide adjustments can be significantly stronger than other forms of fluctuations. There are many different economic-wide drivers of downward pressure or indicators of expansion. They include:
- Federal Reserve’s interest rate adjustments that occur multiple times per year;
- Acts of law by Congress;
- Consumer spending;
- Volume of credit; AND
- Unemployment rate.
Economic-driven fluctuations are easily identified with the change in the DOW Jones Industrial Average. Look at this graph for the past five years.
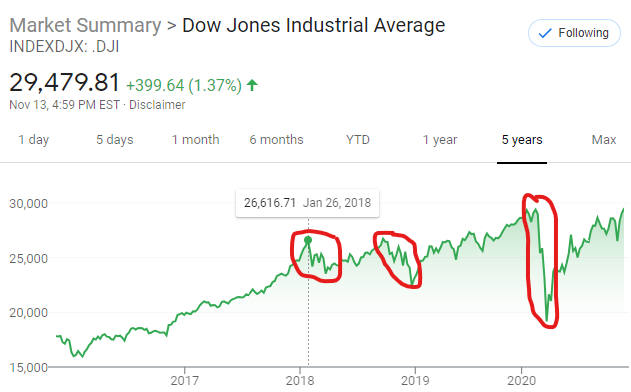 The first period circled in red (Jan – March 2018) is an 8.8% market decrease driven by a sell-off related to the recent DOW lifetime to date high. In December 2017, the Tax Code changed the tax rate for corporations, thus spurring this peak in market value. The long sell-off over two months was merely a correction of the sudden increase.
The second circled decrease in the market value of the DOW index reflects the Federal Reserve’s hike in the funds rate that happened three times in a row. To add fuel to this, President Trump didn’t adjust the 25% steel tariff down to 10% until December of 2018, after the G20 summit.
The third, and biggest sudden decrease, is a direct reflection of the COVID pandemic reaction.
All the minuscule ups and downs are merely reflections of either poor earnings reports or one or two of the DOW companies having issues, driving the index down. This is explained in the company fluctuations section further below.
As a value investor, the key for you is to understand that market fluctuations occur often. Steep changes are wonderful opportunities to either buy or sell, depending on the circumstances. Fluctuations that are economically driven create tremendous opportunities due to their far-reaching impact across the board for all stocks. When they do happen, if you have preset triggers, you will automatically be rewarded for your plan.
Market Fluctuations – Sector or Industry Fluctuations
A second type of fluctuation is a sector or industry-wide fluctuation. Sectors are broader in scope than industry types of businesses. As an example, transportation is a sector, and the auto industry is a part of this sector. Sector and industry-wide fluctuations are customarily driven by changes in law or regulations. Sometimes it is driven by consumer preferences. For example, with the entertainment industry, going out to the movies was in vogue for many years. Then modern technology has shifted that venue to in-home entertainment centers along with delivery models including Netflix, Hulu, and others. It will not be long before going out to the movies will completely evaporate as consumers shift their preference to more intimate venues. It is believed the recent COVID pandemic is going to be the final nail in the coffin for the cinema venue of entertainment delivery.
Thus, the movie theater industry is just one of the industries within the entertainment sector of our economy, and its demise is driven by advances in other new industries.
Another example is the energy sector. Within this sector sits the oil industry. This industry is fraught with peril due to international conflict. OPEC controls a vast portion of the supply of oil, and its production limits can greatly impact the cost per barrel of oil. In turn, this affects the large oil conglomerates such as ExxonMobil, Valero, and Chevron. There is a high correlation between the price of oil and the trend in the market price for oil companies. To validate this, let’s compare the oil price fluctuations over the last twelve years against the stock price for ExxonMobil.
Price for a Barrel of Oil : ExxonMobil’s Stock Price
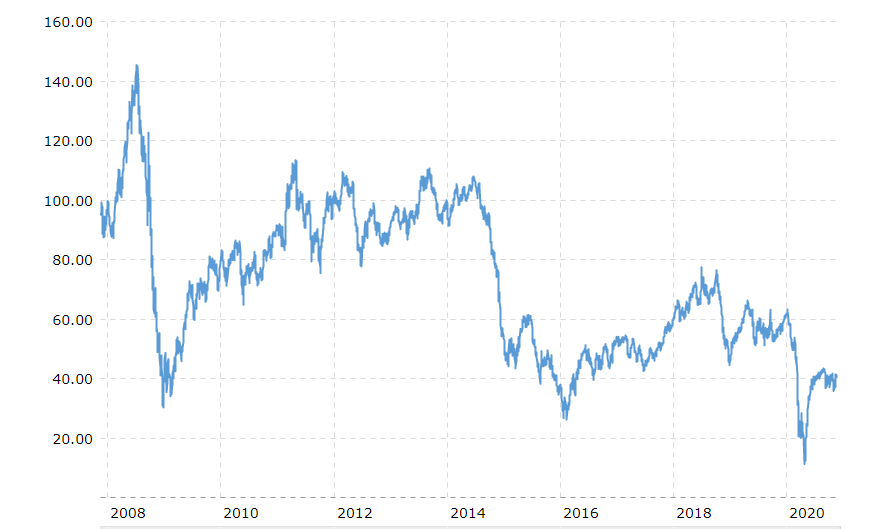
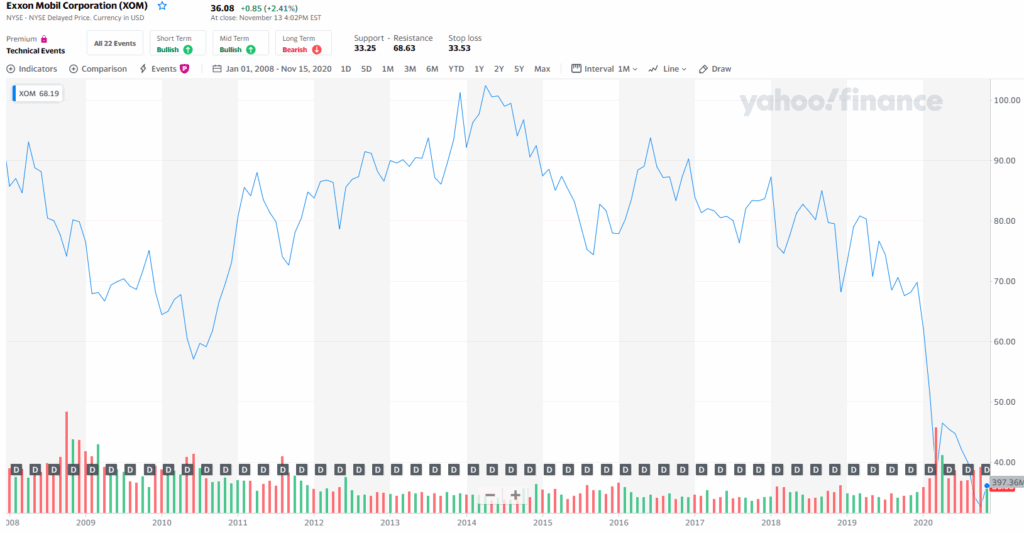
Notice the price of oil in the second half of 2014, with the drop heading into 2015. Now look at Exxon’s share price in the second half of 2014. It too drops going into 2015 and continues into 2016 just like the oil price. Oil finally stabilized in 2016, and Exxon was able to begin recovery. Thus, the price of the inventory for Exxon significantly impacts the stock price for the company. The correlation isn’t 1:1, but it is very strong, and thus, the key lesson is that there are sector and industry factors that create fluctuations with the respective members of this sector. However, economy-wide factors have a greater impact than sector/industry factors. It is still essential for value investors to understand the various factors that impact the respective industry and sector when creating their buy/sell trigger points.
What is interesting is how the market price for stock is so much more volatile related to a company’s financial performance in the immediate accounting period than reviewing the long-term trend. This is where opportunities come to fruition.
Company Fluctuations
Each quarter, corporations report their financial performance and present to institutional security owners and potential buyers what happened during the quarter, along with their projections for the upcoming quarter and into the following periods. It is here that the market often overreacts to any short-term indicator, and the price will suddenly move in a direction. What is important for value investors to understand is that although these are quite frequent (at least four times per year), it is important to remember that the momentary price movement is insufficient to make the dramatic changes value investors desire.
From the lessons so far, you should have ascertained that value investors seek significant market declines or returns to the prior peak market price per share. Quarterly financial reports rarely move a stock’s price three to five percent per share in any direction. Value investors are looking for discounts of more than eight percent or increases back to prior peaks. It doesn’t mean the quarterly reported information can’t be the final nudge in that particular direction, and often, they will have enough impact on the share price to complete the minimum desired change.
For example, suppose the buy trigger for a particular stock in one of your pools of stock is an 11% decrease from the prior peak. It is currently at 10.2% down from the prior peak price. The company releases its quarterly report and indicates that sales decreased by about 1.5% more than expected. The next morning, the market reacts by selling off the stock, and now the share price reaches the desired 11% decrease, warranting a buy opportunity.
Thus, quarterly information can assist in creating the desired changes, but it is rare, if not outright the sole contributor to the dramatic price change that value investors covet.
This provides a direct benefit to value investors. How so? Well, one of the benefits of value investing is that value investors are not concerned about quarterly financial reports. Quarterly reports are merely additional supporting data validating current models developed for buy/sell points for a company. A common pattern for value investors is to not anticipate or eagerly await quarterly financial reports.
Quarterly financial information just modifies the existing trend lines with the models built to determine buy and sell points for stock.
Join the Value Investment Club This site's Value Investment Club (Membership Required) utilizes a Value Investment Fund model with an annualized 23.3% return over a SIX and THREE QUARTER-YEAR history. It has grown from a starting basis of $100,000 and is now $411,989 before taxes of $91,166. This is a 19% annualized return after taxes. Membership provides instantaneous access to time-sensitive information. Membership provides: Value investing, in its simplest terms, means buying securities at a low price and selling them at a higher market value. Value investing is defined as a systematic process of purchasing high-quality stocks at an undervalued market price, quantified by intrinsic value and justified through financial analysis, then selling the stock promptly upon market price recovery. Membership gives the reader full access to all information on this website. Act on Knowledge.
Summary – Market Fluctuations and Value Investing
There is a hierarchy of forces that drive stock market fluctuations. Economic-wide forces have the greatest impact overall. Sector and industry forces are the mid-range forces that swing share prices in a direction. Finally, company financial and performance indicators are the final forces that can affect market price and the fluctuations found in stock prices. Value investors must be acutely aware of these forces and how they impact the respective pools of stock value investors use to create their respective buy and sell models. Act on Knowledge.