
Principle #4: Patience (Lesson 9)

The most difficult principle to adhere to with value investing is patience. There is a mindset that when you have a high level of confidence in your decision model, you are eager to see it come to fruition. The trouble with this is that others in the market don’t see it the same way as value investors. There are numerous investment programs, varying thoughts about buying and selling, and pure greed. All of this combined creates volatility in the stock markets. Reasonable volatility, as found in large-cap and Dow stocks, is what value investors seek. Volatility in mid- and small-cap stocks shifts the mindset from value investing to active trading to achieve good returns. Market fluctuations are necessary in order to create opportunities to realize gains. The other investing systems, programs, and greed cause fluctuations along the spectrum of tiered markets. As the spectrum tends towards the lower end of the tiers, volatility increases. The upper tier, the value investing zone of large-cap and DOW stocks, does experience fluctuations, but nowhere near the volatility of the other zones.
Value investors must be patient to allow these competing forces to sometimes align with each other to either depress or magnify the entire market, an industry, or a particular company. When the market causes a certain stock to drop to the value investor’s preset buy price, an opportunity exists, and the value investor snags up a good deal. If irrational exuberance kicks in, opportunities to sell are presented and gains are earned. In the interim, value investors must simply wait.
There are so many similes to many life experiences, they all can’t be listed here. One good example is that patience in the stock market is like hunting from a deer stand. You know the prize will show itself at some point. Years of experience and lessons learned reinforce your basic instinct to be patient. It is the same for value investing. Good risk management, intrinsic value buying, and financial analysis are rewarded when exercising self-restraint.
This lesson isn’t about emphasizing patience; it is about understanding how patience creates financial wealth in the market. Unlike day trading, which is not much more than gambling, value investing is about earning good returns on one’s investment. The decision models built will never create instantaneous wealth; they are simply designed to take advantage of a good portion of the market price extremes that stocks experience. The first part of this lesson introduces the reader to certain terms used with cycles. It explores cycles with two areas of nature: sound and ocean waves. The next part of this lesson explains how the market as a whole experiences ups and downs just like wave patterns. These cycles, just like sound and ocean waves, have a reasonable correlation to predictability. The next section takes this cycling effect to the industry level of the market. What is commonly called the ‘Pool’ of investments with value investing. This cycling of value continues into the respective investments. These first four sections introduce the overall concept of cycling with stock prices.
With the concept of cycling, this lesson then introduces how a value investor captures maximum return on an investment by smartly setting the respective buy and sell points. There are some drawbacks to this concept. If the cycle is extended, the overall return on the investment decreases. This is covered in the fifth section below. What is important to remember is that even though there may be an extended cycle period, it doesn’t mean the value investor lost money; it simply means the overall return on the investment fund will be less than anticipated. Thus, in some years, your fund may experience only 10% to 15% overall growth, whereas in some other years, it may experience 40 to 45% growth. The key is the long-term approach to value investing. What accumulates wealth is patience, a lifetime of patience.
Patience – Cycle Patterns
Wave patterns are common in both audio and ocean surface movement. A standard visual of an audio wave looks like this:
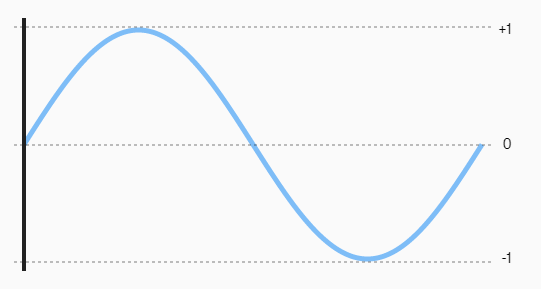
This is one full cycle. The ‘X’ axis (horizontal direction) represents time, and the ‘Y’ axis (vertical direction) represents volume. In business, this same image exists with the respective different markets, not as pure, often rigid, and with more changes as it progresses forward in time. The key here is that the ‘X’ axis still denotes time, and the ‘Y’ axis denotes intensity. The intensity is a numeric value with a baseline of zero.
With ocean wave science, it is somewhat similar. Look at this ocean wave depiction explaining terminology.
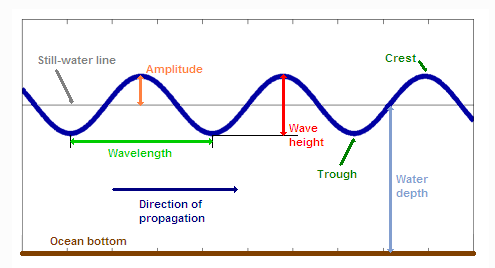
Notice here that there are about 3.5 cycles.
Yes, many of you are wondering, ‘What does this have to do with value investing?’
The stock market also experiences ups and downs, just like these wave patterns. Thus, there is some terminology used with market cycles that somewhat mimics the terminology used with ocean wave patterns. Let’s compare:
Wavelength – with ocean terminology, it represents the period for a full cycle, i.e., a complete top to top of a wave or a full trough to trough cycle. It is denoted in terms of time. With market cycles, it is also denoted in time. Unlike ocean waves, which can be as short as a few seconds, market cycles range from a few weeks (high frequency) to years (extended frequency). In economics, it often takes years to complete a full economic cycle. The most commonly accepted economic cycle is about 11 to 14 years. This means that the economy will go through a growth period, a leveling off or slow growth, then a sudden recession (in extreme cases, it is referred to as a depression), and the cycle starts all over again. Typically, the recessions are very short in duration, about one to two years.
Amplitude – when a wave peaks in height, it is compared against the still-water line (think of a calm lake) to determine its strength. The higher the amplitude, the more powerful the wave is. In business, it is similar. Here, the peak point is often referred to as the market high. With the DOW Jones Industrial Average, those involved in the brokering business talk about achieving new highs, like breaking 38,000 points.
Crest – unlike amplitude, a crest can exist at various levels. The same exists with market terminology. Here, the term peak price or most recent high represents the crest.
Wave Height – With an ocean wave, the wave height depicts the maximum change in a single wave. Stock market indices represent the volatility of the respective market during that period. If there is a sudden drop, then a peak in price, it is referred to a volatility. Whereas a slow downward and then upward shift over an extended period (several months) is considered reasonable or normal.
Still Water Line – with oceans, the still water line is considered stagnant, never changing (technically, it is rising due to ice melt, but for this lesson, it stays unchanged). In the respective different indices, there is no still water line. There is an imaginary line of value that has been ever-increasing since the indices were developed. This long-term increasing value line represents the impact of the entire expanding economy on the respective index group. Thus, there is one slight difference between the ocean wave cycle concept and standard market cycles. When the imaginary value line is trending up faster than historical normal, it is referred to as a ‘Bull’ market. If this line is decreasing, no matter its angle, it is called a ‘Bear’ market.
With the terminology explained, the next section will explain and illustrate market cycles. Pay close attention to frequency (periods) and amplitudes (peak points).
Market Cycles and Patterns
Value investors are limited to three common indices representing a portion of the entire top 2,000 publicly traded companies. Other indices are either too broad in scope or highly defined to a particular economic sector. The three top indices value investors use are 1) the DOW Jones Industrial Average, 2) the S&P 500, and 3) the S&P Composite 1500.
This is a snapshot of 40 years of the S&P 500.
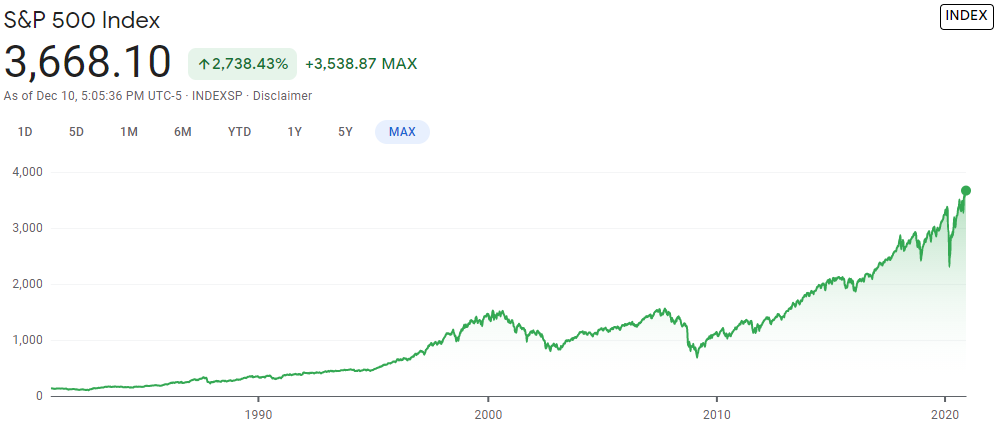
Notice the upward trend overall. Secondly, within these 40 years, there are hundreds of full cycles. Some may have occurred within a single day, others within weeks. During this period, there are cycles within larger cycles that are within even longer cycles. The point here is that the so-called ‘Still Water Line’ is continuously rising. This is an important characteristic of value investing. Value investors know that this line will continue upward over the next 40 years. IT HAS TO for the economy to expand. It can reduce its trajectory by a lower incline, and that is OK too. What happens economy-wide affects all investors. The goal of value investors is to simply outperform others over an extended period of time.
Now, let’s look at a narrower window of time and discover the cycles that exist. Here is the same S&P 500 over the last five years.
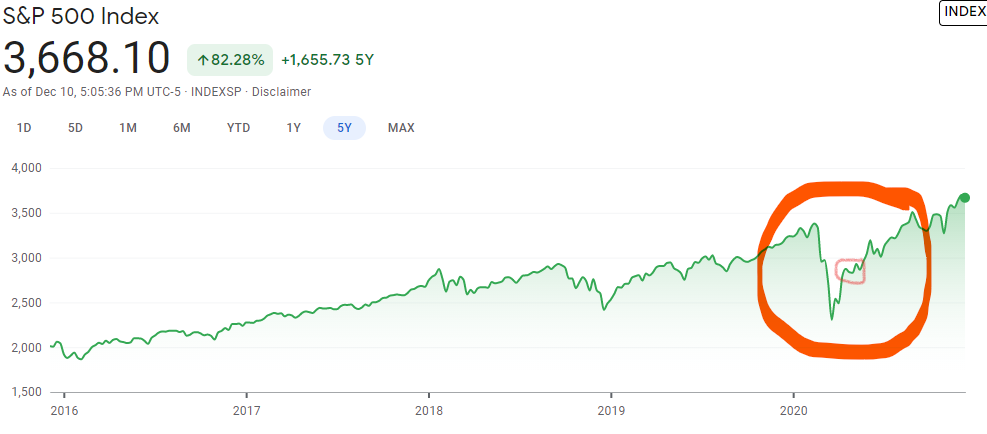
Notice that over the last five years, the S&P 500 has had many different cycles, some are frequent and others are more extended.
Do you notice the peaks? Remember, with ocean waves, they are referred to as crests. Can you detect the wavelengths? If not, it is OK the next exhibit will clear this up for you.
The one point of this exhibit is that if you look at the early 2020 time frame, notice that there is a cycle within a cycle. If we were to close in on this, we would find even cycles within cycles down to a few minutes. The point is that cycles can exist within other cycles. Overall, though, compare this to the concept of wavelengths. During some time periods, the cycles are reasonable, not volatile, while with other time periods, there can be significant volatility. Look at the chart around the 4th quarter of 2018. Notice the significant drop in the index and then the recovery during the first half of 2019. This is important to understand. In general, the market index recovers. Let’s narrow this down to what appears to be a relatively calm period of time, whereby the ‘Still Water Line’ simply improves. Let’s look at the time period of 2017. Are there cycles within this period? Let’s see if you can detect the wavelengths in this next exhibit.
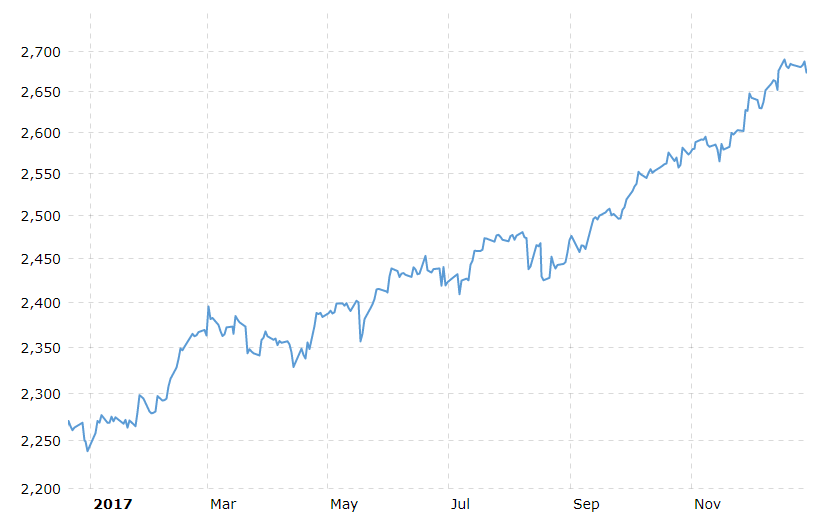
You can now begin to detect shorter cycles and cycles within cycles. Take a close look at the two months of March to May. Notice that at the beginning of March that the S&P is nearly 2,400. Around the first week of May, it is again nearly 2,400. During these 9 weeks, there are multiple cycles with some internal peaks and troughs (low points).
Walk through this logically. There are 500 different stocks compounded together, causing this aggregated index value to increase or decrease during this period. Assume that two or three of them are related to the 18 to 30 you target in your respective pools of investment. This would mean that those stocks presented opportunities to buy, and then when they recovered a few weeks later, they were sold.
This is what value investing is all about. It is obvious that highs and lows are going to occur. Value investors recognize this, and the goal is to take advantage of these cycles.
Now, don’t think that this is easy. You still have to do your work to identify good buy and sell points. The point of this exercise is to illustrate to you that, economy-wide, there are going to be cycles. These cycles benefit value investors because they have the greatest influence on stock market price changes for stocks. The main point of emphasis is that as a whole, the economy is continually expanding and as such, this change works to value investor’s benefit. Even if the economy contracted, it is still beneficial to the value investor because gains will not be as strong, but will be superior to other investment models. Value investors are interested in the economic-wide change over shorter periods, not extended periods.
Take note, the above illustrates the S&P 500. Are there indices for particular industries? Can these indices help value investors with their pools of investment pools? Do cycles exist within these industry-wide indices?
Patience – Industry Level Cycles
There are indices at the industry level. This is important for value investors as having an industry index that corresponds to a pool of similar investments aids the value investor in making better buy/sell models for that particular pool. Here is an example of the banking index:
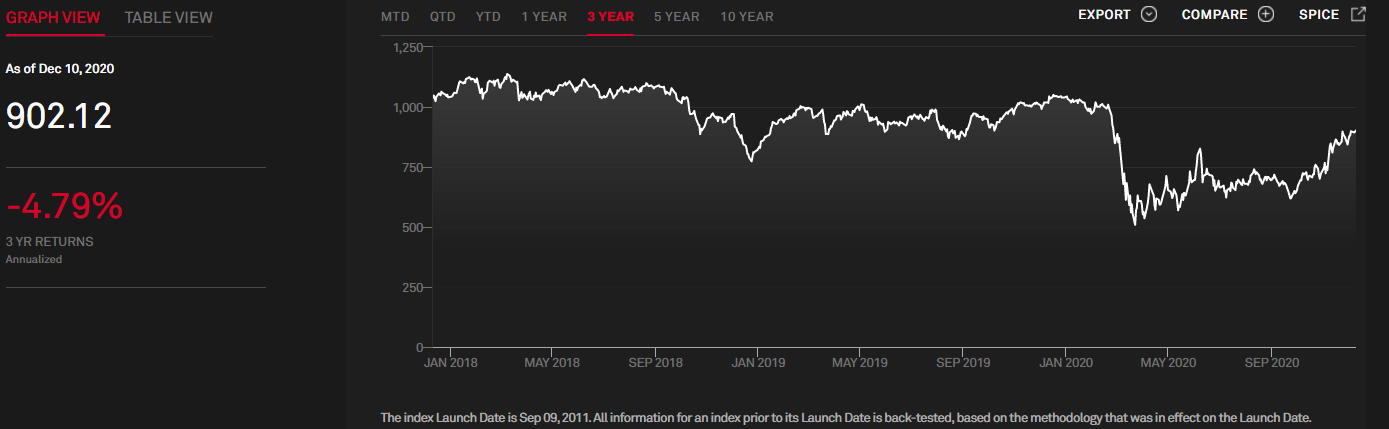
Take note, the industry as a whole has been performing poorly over the last three years. But still, within this period, there are multiple cycles. There is a different approach that value investors exercise with ‘Bear’ market-based industries, and this is covered in Phase Three of this program.
This next exhibit is the same index, but reflects a three-month time frame as of 12/10/2020:
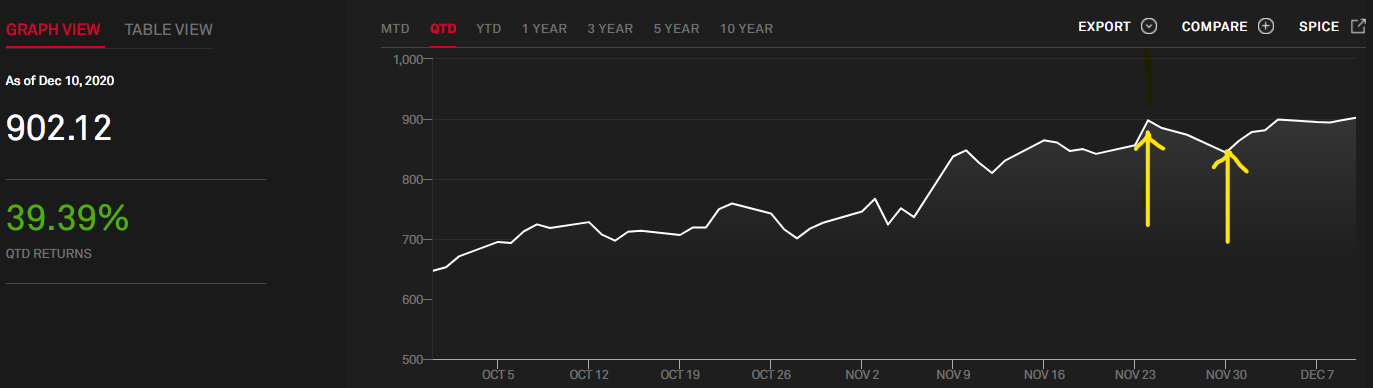
Take a look at the two points between the yellow markers. This is a 6% change in this index during this one week. Notice that within one additional week, the index recovers. Assume one of your pools is a banking pool. The fact sheet on this index indicates there are 88 financial institutions monitored. The top 10 make up 20% of the aggregated results.
Suppose Comerica Inc. is in your pool of banking investments. Your preset buys/sells are 6% decreases and a 97% recovery; thus, a 3% spread. Take a look at Comerica’s stock price change during this same period.
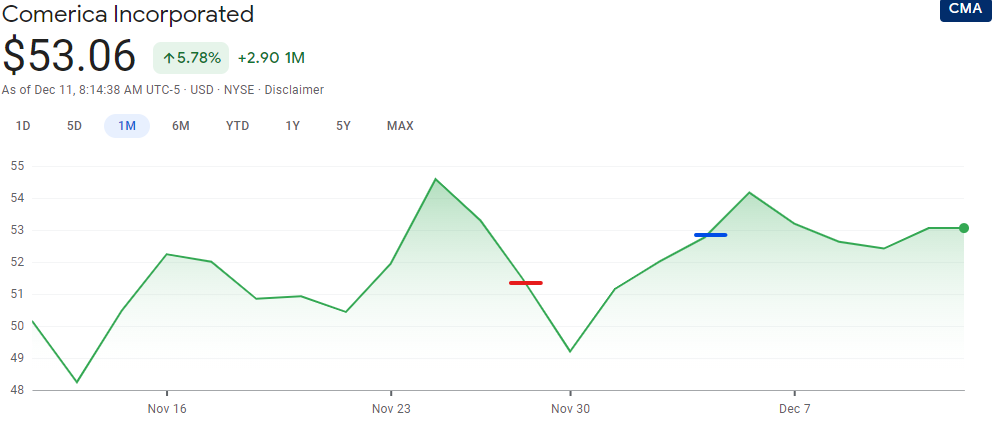 On November 24, 2020, Comerica peaked at $54.59. On November 27, 2020, the price dropped to $51.31 (Red Marker), which is a 6% decrease from the peak point, which is a trigger to buy the stock. Remember, these triggers are preset based on your intrinsic and financial analysis for each potential investment within your Banking Pool.
Your selling point is 97% of the prior peak point, which is $52.95 (Blue Marker).
During this eight-day holding period, the stock price continued downward, but recall that the financial analysis conducted along with the intrinsic value calculation assured you that a price depression rarely exceeds 12% and therefore, the risk of a sustained depressed price was negligible. Your model also assures you that the recovery is often quick, and thus, patience will reward the investor. In this case, the value investor earns $1.64 on a $51.31 investment. The absolute return was 3.19%. Many of you reading this will say, “Well, that is not impressive”. It is very impressive. Extrapolate this result out over one year, and the actual relative annual return is now a whopping 145%.
A few interesting connections to value investing’s principles and concepts. First off, notice that it is possible to have much deeper discounts and make a much greater return on the investment. Suppose the discount was 8%, the buy price would have been $50.22 on 11/27/2020. The holding period is still eight days. However, the gain would have been $2.73 per share, which is a 5.4% return or an unheard of 248% annual return. Another connection relates to greed. Value investors seek out ‘reasonable’ anticipated changes to make good returns on an investment. Now and then, exceptional returns will occur, but these are driven by higher frequency periods (wavelength) than the idea of a deeper discount (trough) and higher peak (crest).
This takes us back to cycles. How often does Comerica have cycles that are 8% changes versus cycles with 6% changes? This is the frequency key that makes value investing so successful. The next section explores this very issue with company-level cycles.
Understanding industry financial dynamics and having preset buy and sell points for the respective members of the investment pool provides unique opportunities. In March of 2023, Comerica had a sudden price drop upon trade opening. The Value Investment Fund purchased the stock, and by 11 AM, the rebound reached the preset sell point, creating the best return on investment for this Fund’s history. In effect, the investment almost doubled its money in less than three hours. Read about this trade event here: Comerica Trade.
Patience – Company Level Cycles
Value investors look at cycles at the corporate level, too. Here, there are two questions. First, how often are there significant peak-to-peak activities, and secondly, what is a reasonable discount to peak change within these peak-to-peak cycles?
Sticking with Comerica. Here is Comerica’s stock price activity during six months (mid-June to mid-December 2020):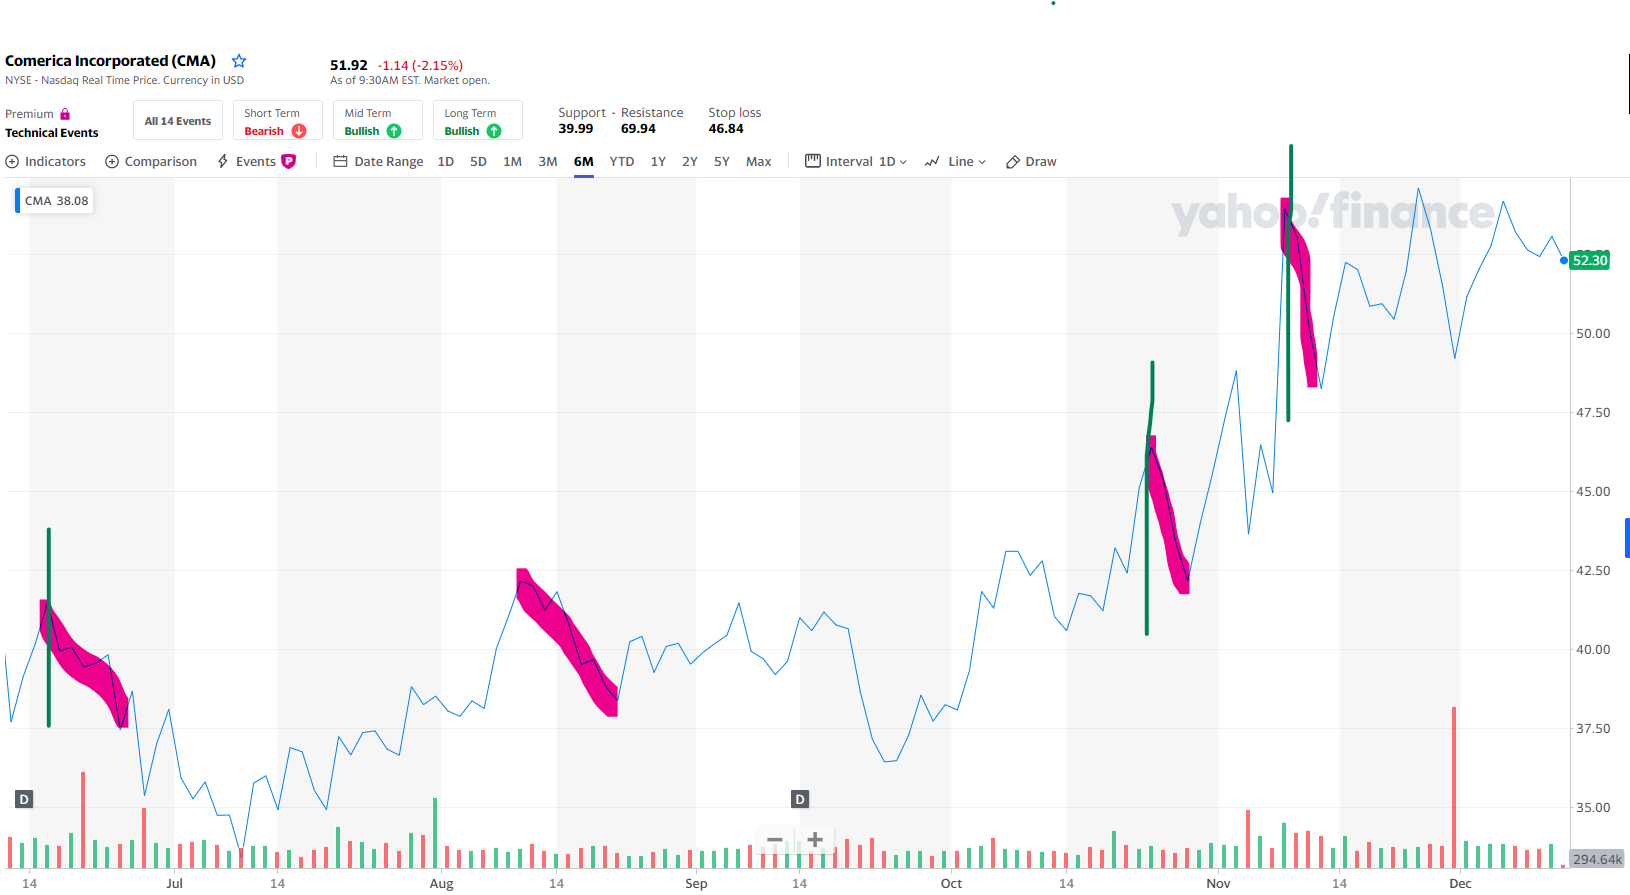
With the existing Investment Fund’s Banking Pool (requires membership to access the data), Comerica’s buy/sell model dictates a 9% drop in market price from a prior peak to buy the stock. The sell point is 102% of the prior peak. The above chart identifies four times during the last six months where there is a minimum 9% drop in the market price.
On 06/16/2020, denoted by the green line drawn vertically on the chart (ignore the volume indicators of green and red at the bottom of the chart), the price on that day peaked at $41.47. The 9% discount occurs on 06/24/2020, denoted by the end of the wide pink downward mark. On that day, the price with 9% discount is $37.74. It is at this moment that the value investor purchases this stock. Notice how the price continues to decline over the next few weeks and then begins to recover. There is another 9% decline from 08/11/2020 to 08/21/2020. HOWEVER, the investment fund did not buy at this point. Why?
The recovery point had not been met yet. Recovery is 102% of the prior peak. Prior peak is $41.47; thus, the sell point is $42.30, which occurs on 10/07/2020. The August 11th price is $42.15.
On 10/23/2020, a new peak is achieved (crest in ocean wave terminology). This resets the new buy price at 9% discount from the prior peak. On 10/28/20, the fund buys Comerica for $42.21 a share. This is denoted at the bottom of the pink downward line. On 11/09/2020, the stock was sold at $47.32, which is 102% of the prior peak. Now the whole process starts all over. A new peak occurs on 11/09/2020 and resets the entire schedule to a peak price of $53.93. On 11/12/2020, a 9% decrease exists from the prior peak, and the fund buys at $49.08. It is now waiting to sell once the stock price hits $55.01 (102% of $53.93).
Thus, during the last six months, there were 2 full transactions and an existing buy for this stock in the pool. How well did the two transactions perform? Let’s do the math:
Transaction #1
Buy on 06/24/2020 $37.74
Sell on 10/07/2020 42.30
Gain per Share 4.56
Costs to Trade/Share (2.00)
Net Gain per Share $2.56
Investment Basis/Share $38.74 (Actual Cost Basis + $1.00 Transaction Fee/Share)
Absolute Return 6.6%
Holding Days 106 Days
Annualized Return 22.75%
Transaction #2
Buy on 10/28/2020 $42.21
Sell on 11/09/2020 47.32
Gain per Share 5.11
Costs to Trade/Share (2.00)
Net Gain per Share $3.11
Investment Basis/Share $43.21 (Actual Cost Basis + $1.00 Transaction Fee/Share)
Absolute Return 7.20%
Holding Days 13 Days
Annualized Return 272%
With the first transaction, the return was reasonable, and the holding period was a little over three months. Whereas with the second transaction, the short holding period of only two weeks accelerates the annualized return. Go back to the ocean wave depiction; a higher frequency between cycles is a desired characteristic for stock investment. There is an increased risk with higher frequency, thus it is important to ensure intrinsic value exists with the stock in order to ensure a good safety margin. With Comerica, the book value of the stock is in the low 50s per share. Thus, a higher frequency below book value is a desired attribute for quality investments.
During this sixth-month period, Comerica Bank stock has earned a net $5.67 per share on an average investment basis of $40 per share or around 14.17% absolute return. This annualized average return is around 30%.
Now the question is: ‘Can we increase our return on the investment by either reducing the discount/sell points, thus having greater frequency of activity, or by extending the buy/sell criteria?’.
Patience – Frequency of Cycle’s Impact on Value Investing
Recall that with ocean wave terminology, wavelength refers to the period between either peaks or troughs of a wave. With business, the typical wavelength or frequency changes all the time, but it still refers to a peak-to-peak review. With the Comerica Bank six-month chart above, the first peak to peak with this depiction is about two months, mid-June to mid-August. However, based on the buy/sell parameters, the next peak has to crest at least 102% (the minimum recovery sell point) of the prior peak. This adjusted second peak turns out to be 10/07/2020, almost four months later. Thus, the first full transaction took 106 days.
Many inexperienced value investors often ask, What if we deepened the discount and raised the crest requirement, thus acquiring a greater absolute return on the investment. Yes, the return on the investment will improve significantly; it mathematically has to be based on the greater spread (amplitude) between the two points. The question is this: ‘Is this a superior method than more modest discounts and modest recovery points (crests)?’. Let’s find out.
Using the same initial peak date of 06/16/2020, let’s assume the discount is now 11% and not 9%. The first time there is an 11% discount from a prior peak occurs on June 26th, when the price dips to $37.15. Now we are looking for a stronger recovery point, and let’s use 103% of the prior peak and not 102% as used above. Thus, 103% of the prior peak of $41.47 is $42.71, which happened on October 7, 2020. Here are the transaction’s earnings:
Transaction #A1
Buy on 06/26/2020 $36.91
Sell on 10/07/2020 42.71
Gain per Share 5.81
Costs to Trade/Share (2.00)
Net Gain per Share $3.81
Investment Basis/Share $37.91 (Actual Cost Basis + $1.00 Transaction Fee/Share)
Absolute Return 10.05%
Holding Days 104 Days
Annualized Return 35.27%
This is a huge improvement over Transaction #1, yet almost identical in every way except that the spread is an additional 3% in the aggregate. Furthermore, there are two fewer days of holding time, and the margin of safety tied to intrinsic value is better; thus, less risk is involved. Why didn’t the investment fund pursue this as its buy/sell parameters?
To answer this, we must continue to look at the balance of the six-month time period. The fund is now looking for the next 11% discount from a prior peak (crest). The next prior peak with a corresponding 11% discount has not occurred as of 12/11/2020. There have been several new crests along the way, but no discount large enough from that crest to meet the more aggressive parameters as set in the model.
What the model demonstrated in the prior section (9% discount/102% recovery) is that two full transactions and a current active hold means that more than likely the investment will have three full transaction cycles in comparison to the more aggressive buy/sell set of parameters, as illustrated with Transaction #A1. In the above section, the two full transactions have already generated $5.66 of realized gains. This more aggressive model has only realized $3.81 of realized gains.
The lesson here is simple: if the model dictates a more aggressive set of buy/sell parameters, the frequency of transaction activity is greatly diminished. The more aggressive model is more lucrative per transaction and less risky because the value investor purchases the stock for less than the modest model in the prior section. However, the total aggregated income goes down! Yes, value investing is about buying low and selling high. However, if the buy/sell points are too strict (aggressive), the value investor may never have an opportunity to exercise this very risk-reducing approach. Value investing means to buy low and sell high under ‘REASONABLE‘ parameters, not highly restrictive.
In order to compensate for a highly restrictive model, you would have to have a much larger pool of investments; the author estimates more than 50 different stocks among 8 different pools to accumulate similar aggregated dollars. This is covered in more detail with Phase Three during the sophistication part of this program. With this many stocks, value investing becomes a full-time job.
Given this, then why not be more liberal with the parameters and take advantage of the multiple cycles with less amplitude (spread) of change between peaks? Let’s explore this.
Now, suppose that instead of a 9% discount, the parameters are more liberal and the value investor sets the buy point at 7% of the prior peak and sells at 101% of the prior peak. The results should show more activity during this same period.
Same start date as before, with a prior peak on 06/16/2020 of $41.47. The new buy price is $38.57. The recovery point is reset to $41.88. The buy date is June 24th, and the sell date is August 11, 2020. Here are the transaction results:
Transaction #B1
Buy on 06/24/2020 $38.57
Sell on 08/11/2020 41.88
Gain per Share 3.31
Costs to Trade/Share (2.00)
Net Gain per Share $1.31
Investment Basis/Share $39.57 (Actual Cost Basis + $1.00 Transaction Fee/Share)
Absolute Return 3.31%
Holding Days 49 Days
Annualized Return 24.66%
Notice a couple of interesting conditional issues that drive the return on the investment. The realized amount is a mere $1.31, driven by the costs of activity; i.e., the value investor is paying two dollars to the broker for a $1.31 return. Secondly, the holding period is drastically reduced in comparison to the modest or more aggressive models. Also, the risk factor is higher because the basis with the buy is much higher than the modest model, by 83 cents a share. Remember from Lessons 7 and 2, risk aversion is essential with value investing.
However, with this more liberal model, there are now new opportunities. The next 7% discount from the peak occurs on 08/02/2020 and from the peak on 08/11/2020. On that day, the price peaked at $42.15, and on 08/11/2020, the 7% discount kicks in for a buy of $39.20. The 101% recovery point occurs on 10/07/2020. Here are this transaction’s results along with the next three full transactions:
Transaction #B2 Transaction #B3
Buy on 08/20/2020 $39.20 Buy on 10/27/2020 $43.14
Sell on 10/07/2020 42.57 Sell on 11/02/2020 46.85
Gain per Share 3.37 Gain per Share 3.71
Costs to Trade/Share (2.00) Costs to Trade/Share (2.00)
Net Gain per Share $1.37 Net Gain per Share 1.71
Investment Basis/Share $40.20 (Actual Cost Basis + $1.00 Transaction Fee/Share) Investment Basis $44.14
Absolute Return 3.41% Absolute Return 3.87%
Holding Days 48 Days Holding Days 6 Days
Annualized Return 25.91% Annualized Return 236%
Transaction #B4 Transaction #B5
Buy on 11/04/2020 $45.39 Buy on 11/11 /2020 $50.15
Sell on 11/09/2020 49.30 Sell on 11/24/2020 54.47
Gain per Share 3.91 Gain per Share 4.32
Costs to Trade/Share (2.00) Costs to Trade/Share (2.00)
Net Gain per Share $1.91 Net Gain per Share 2.32
Investment Basis/Share $46.39 (Actual Cost Basis + $1.00 Transaction Fee/Share) Investment Basis $51.15
Absolute Return 4.12% Absolute Return 4.54%
Holding Days 6 Days Holding Days 13 Days
Annualized Return 250.5% Annualized Return 127%
On 11/24/2020, the newest crest is $54.47, and on 11/30/2020, a 7% discount to the prior peak happens, and the fund buys at $50.66 and is holding as of today, 12/11/2020. The recovery point is $55.01.
The above five full transactions earned realized gains of $8.62 over the same period. This equates to an annualized return of approximately 39% based on an average investment basis of $45 per share.
It appears that this more liberal model is more lucrative to the value investor. The realized gains are $2.96 greater than the modest model and $4.81 over the more aggressive model. The key to this successful approach is the volatility of the stock. The more volatile the stock, the more liberal the discounts and recovery points may be. The problem is the risk factor involved. Notice that with this liberal approach of lower discounts and lower recovery points, the only reason it was successful was because on the same day, November 9th, 2020, the stock’s price recovered to the required $49.30 (See Transaction #B4) and continued until it closed at $53.93. In one single day, the stock’s market price improved $8.98 (20%). The very next day, the price started to drop ($1.20 in one day/2.3% down) and continued until on November 11th it hit the 7% discount and the fund bought at $50.15 (See Transaction #B5). Thus, in 3 business days, this stock’s price had a full cycle of $11.30, more than 23% of its intrinsic value. This rare cycling effect added $2.32 to the overall results. For the reader’s understanding, on November 9th, the entire market exploded upon the news that Pfizer’s Phase 3 testing of the COVID-19 vaccine was successful.
In effect, this frequency of activity is rarely observed with high-quality stocks. Earning these types of returns assumes a very high frequency of discounts and recoveries, and they simply do not happen with higher quality stocks. This type of volatility is more present with low-caps and penny stocks. It is one level up from day trading, commonly referred to as active trading. Also, look at the work involved in keeping up with entering buy/sell orders with the broker.
The modest approach is not only reliable, but is less risky because the deeper discount price provides a better margin of safety and, in addition, there are fewer dollars invested per share on average. Don’t kid yourself, the above liberal model was presented to illustrate a rare occurrence related to the crests and troughs of high-quality stocks. It is only because of the one additional transaction that the return of this model outperformed the modest model. What if only three transactions occurred during this same period? Total earnings would be similar to the modest model, and yet the risk factor is much greater as there is more invested with the liberal model.
Go back to Lesson 1, value investors are looking for reasonable outcomes; aggressively pursuing more dollars by applying liberal models increases risk and exposes the investment to much lower overall returns. Without volatility, an investor can not acquire the gains necessary to match the modest approach of value investing advocates. High volatility is the enemy of value investing. To help you further understand this, look at this table.
Type of Trading Risk Factor Return Potential
Day Trading Highest Negative (During ‘Bear’ Markets, Day Traders Absorb Huge Losses)
Active Trading High Highest (Requires Volatile Stocks w/Good Information)
Buy/Hold Low Good (Assumes Investment was Bought Low w/Good Dividends)
Value Investing Low High (Requires Modest Models to Ensure Returns)
With value investing, the more aggressive the discounts and higher recovery points, the longer the hold required with the stock, which in turn lowers the overall return on the investment; you still get good returns, just not high returns (> 20% year after year).
Join the Value Investment Club This site's Value Investment Club (Membership Required) utilizes a Value Investment Fund model with an annualized 23.3% return over a SIX and THREE QUARTER-YEAR history. It has grown from a starting basis of $100,000 and is now $411,989 before taxes of $91,166. This is a 19% annualized return after taxes. Membership provides instantaneous access to time-sensitive information. Membership provides: Value investing, in its simplest terms, means buying securities at a low price and selling them at a higher market value. Value investing is defined as a systematic process of purchasing high-quality stocks at an undervalued market price, quantified by intrinsic value and justified through financial analysis, then selling the stock promptly upon market price recovery. Membership gives the reader full access to all information on this website. Act on Knowledge.
Patience is Key
In the opening paragraph of this lesson, it was stated that reasonable volatility, commonly found with large-cap and DOW stocks, is tolerable and necessary in order to earn good returns on buy/sell decision models. As stock cycle frequency increases, chaos begins to creep into the picture of buying and selling stock. The concept of systematic buying and selling shifts from value investing towards active trading. This shift requires additional time commitment with much greater risk involved. Furthermore, finding highly volatile quality stocks is difficult because the two attributes are diametrically opposing. You can’t have quality with greater volatility.
Value investors build good buy and sell models for each respective potential investment within a pool of similar investments. With a few pools available, a value investor has adequate diversity to earn good returns. These buy/sell models utilize modest discounts and recovery points to exercise the buy and sell transactions. It is here that faith in the model is practiced by engaging patience. Patience is the key to successful value investing. Act on Knowledge.