
Setting Buy and Sell Points (Lesson 16)

“The big money is not in the buying and selling … but in the waiting” – Charlie Munger.
Setting buy and sell points for any investment security determines the investment’s final return. If the buy is made too early while the security is falling in price, the value investor loses out on not only additional margin upon the sale of that security, but also reduces their margin of safety associated with the intrinsic value point. It is similar to the other side of intrinsic value. If sold too soon, the value investor leaves money on the table. Thus, setting the buy and sell points is are important decision for every investment.
There are tools available to determine these two values. In the simplest of statements, the easiest rule to follow is the Pareto Principle, commonly referred to as the old 80/20 rule. This rule basically states that roughly 80% of all outcomes are within 20% of a focal point. With security pricing, this principle is simply that 80% of the value changes will occur within 20% of the intrinsic value. Therefore, if a security’s intrinsic value is $80, then the probability is that 80% of the maximum change in value will happen within 20% of the core value. Therefore, the buy is approximately $64, and the sell point is $96. Almost certainly, this rule isn’t pure with security investing. The conception is that if the results are beyond this 20 percent under and over the intrinsic value point, the value investor must have additional financial support and a lot of history with the security to validate expanding the buy and sell points beyond 20% fluctuation. This does not mean that the buy and sell points are exactly 20% deviation from intrinsic value; it merely states that there is an 80% probability that the buy and sell trigger points are within 20% of intrinsic value. The key point here is that if you can find a 20% deviation on both sides of intrinsic value with high-quality securities, then you have an excellent potential for a good return.
This lesson first introduces a basic model to illustrate and reinforce setting the respective buy and sell points. This model emphasizes an important aspect of price change. The angle of change affects the return on the investment. The steeper the price change, the shorter the period for the change. The shorter the holding period for any investment, the greater the return on the investment. This is illustrated with a chart in this section of the lesson.
Once the basic principle of the price angle is understood, it becomes straightforward to create formulas to determine the preset buy and sell points. This lesson introduces three quick and simple tools to assist with setting these two points around intrinsic value. The first formula is the price-to-book ratio converted into dollars. The second tool is the adjusted prior dip or peak price point. The third, and highly restrictive, is the price-to-earnings ratio.
Lesson Three explains how fluctuations exist not only in the market as a whole, but with the economic sector, the industry group, and the respective investment securities of each company. Some companies experience wild fluctuations in bursts over extended time periods. Others have stable, low variances.
A perfect example of a highly stable, minimal variance security is Coca-Cola. Review Coke’s price fluctuations over the last ten years.
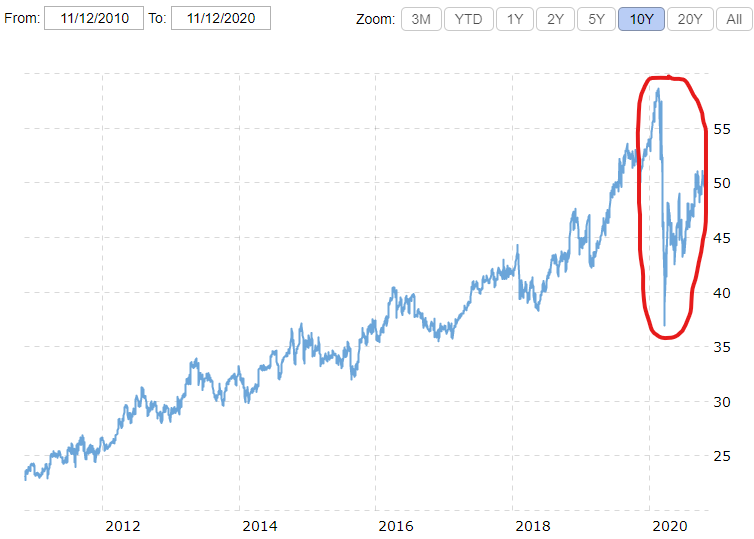
Other than the aberration circled in red, driven by the sudden market decline in February/March of 2020 (COVID market decline), there is a steady incline in the market price of Coke’s stock. As the line moves along the time spectrum, there are lots of small peaks and valleys, including some built-in high points to low points. For example, look at the middle of the 2014 – 2016 grid block. Right in the middle, the price peaks to $37, and by around November of 2015, the price bottoms out at $32 a share.
It occurs again in early 2016 with a peak just above $40 and a dip to almost $35 by late 2016. Thus, in nine months, Coca-Cola’s share price deviated a total of $5 (approximately 7%) in a single direction. Without deep changes, at least 12% changes in a single direction, a value investor will find it very difficult to create enough delta with price deviation to justify the investment if a reasonable return is desired (more than 30%). Only during the sudden steep drop in March of 2020, when the price changes 35% is there an opportunity to earn a good return. Coca-Cola is just that high of a quality of stock. It is considered one of the top 10 stocks to own if you can buy it when there is a sudden and dramatic dip in its market price. The closest similar dip occurred back in the 2008 – 2009 time period during the housing market collapse. Thus, Coke rarely has a significant price dip or a dramatic increase in value.
This illustration emphasizes the importance of understanding a security’s pattern. Two questions must be answered. First, are there frequent enough changes over time? Secondly, are these changes dramatic enough to warrant inclusion in an investment pool of funds? The first section below provides a model of price change and the time period involved when developing potential investments.
Setting Buy and Sell Points – Basic Model Required
The ideal value investing model would have a straight line intrinsic value with a predictable security price fluctuation, with at least a 20% change in both directions within a one-year time frame. This would allow for an above-average annual return. Look at this stock’s price change over a single year.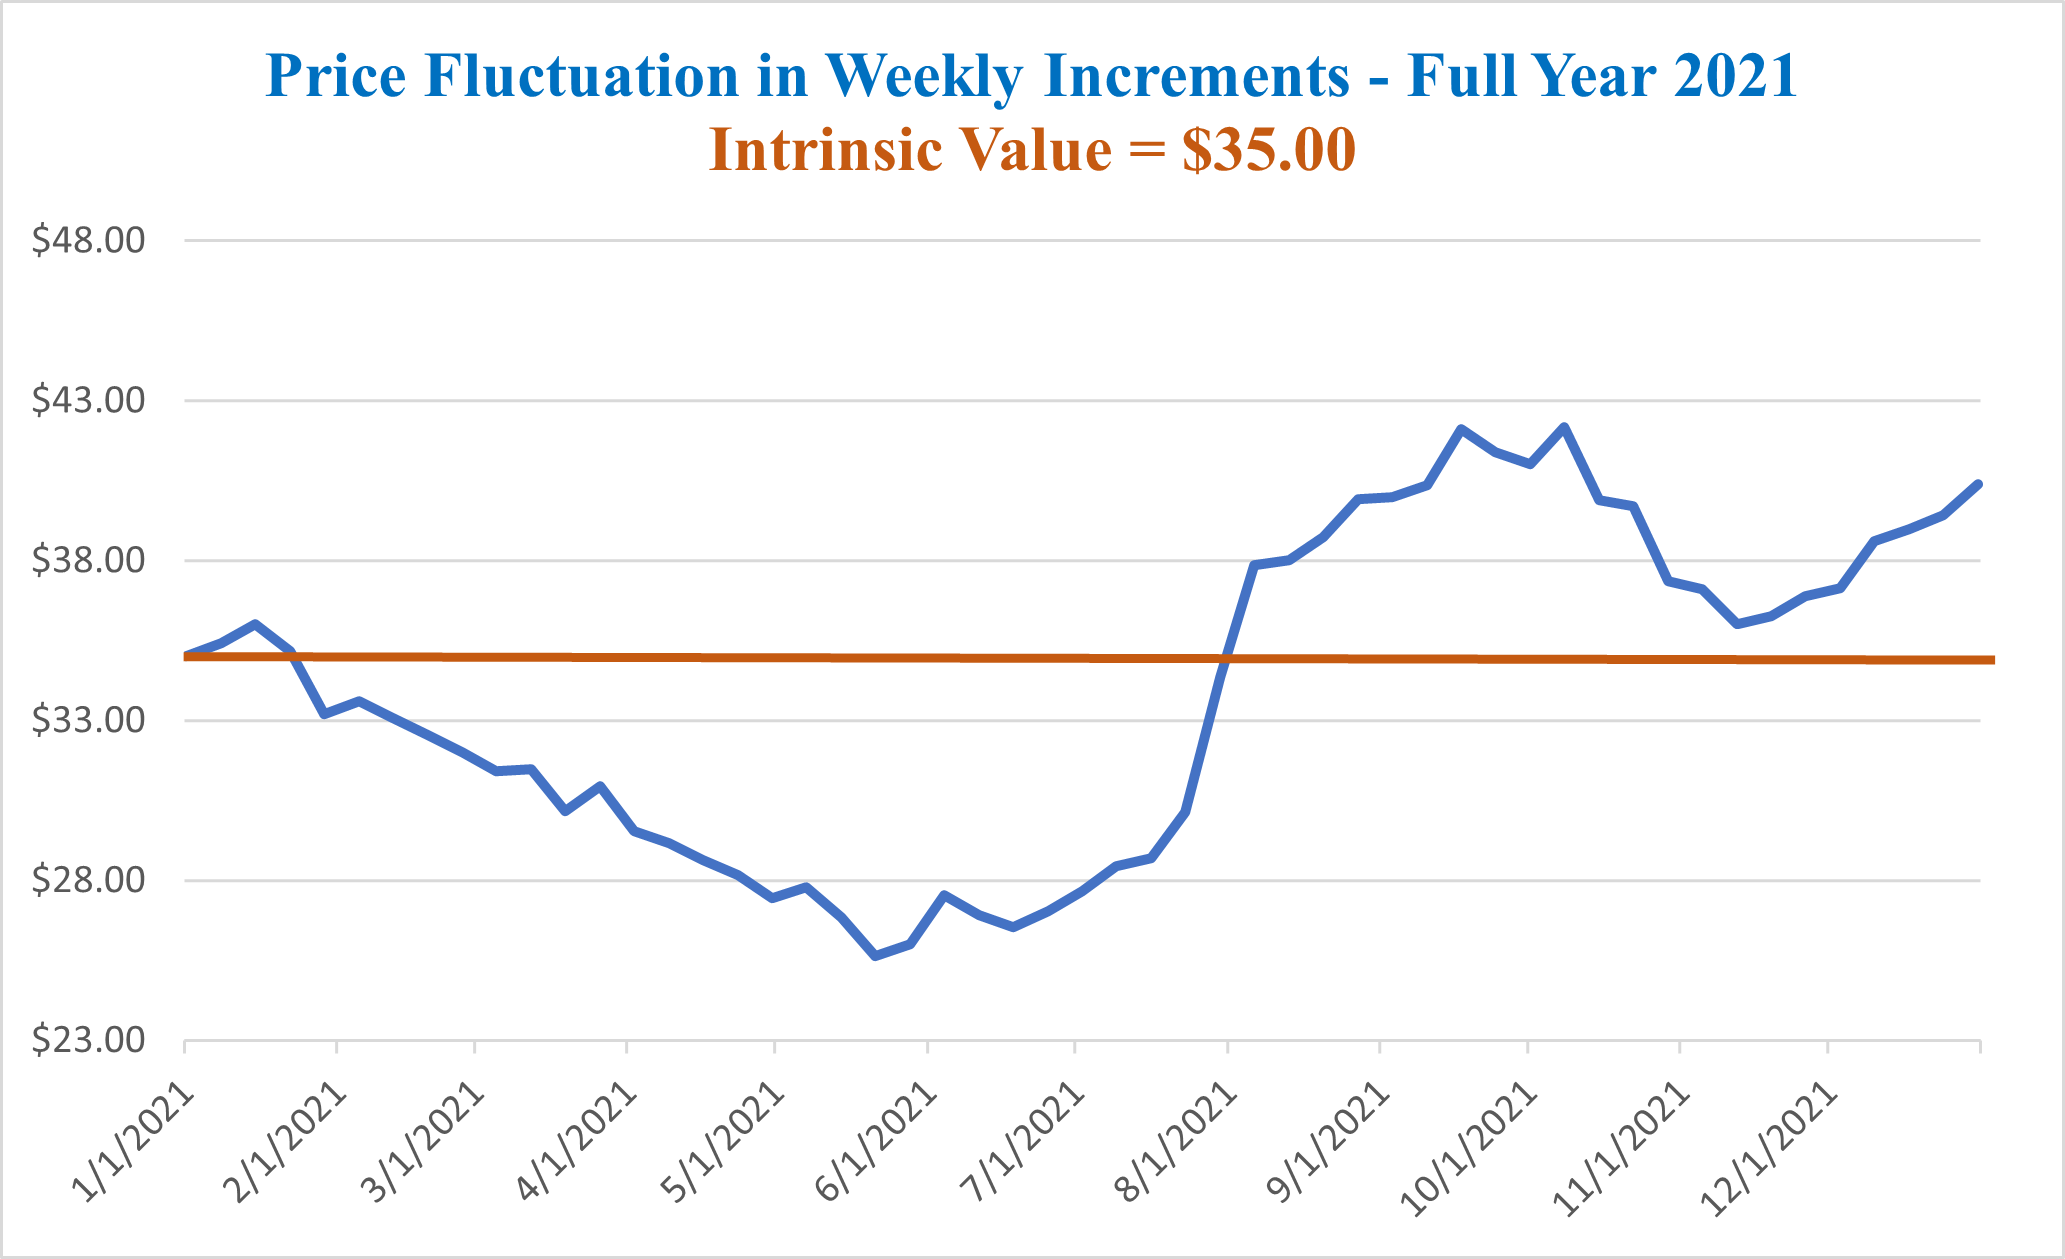
On the first day of the year, both stock and intrinsic value start at the same point, $35. The determination to purchase and sell is 20% below and above the intrinsic value point. Thus, the buy is made at $28 per share, and the sell occurs at $42 (120% of $35).
The price dips to $26 on 05/28/2021. However, it hit $28 around 04/23/2021. Since value investors use computer orders to buy and sell, the stock was purchased on 04/23/2021 at $28 per share. At the same time, a transaction fee of $1 per share. Thus, the total investment is $29.
Over the next month, the price continues to drop and reaches the low point on 05/28/2021 and begins to swing back towards intrinsic value. On 07/02/2021, the price crosses over the 28-dollar point and continues to climb to $35 on 07/30/2021. The model’s rule is to sell at 120% of intrinsic value, $42. It finally hits $42 on 09/17/2021. The computer-generated order completes the sale and charges $1 for the transaction fee. Thus, the value investor nets $41 on the sale. The original investment is $29 (buy price of $28 plus $1 transaction fee). The gain on the sale is $12 ($41 minus $29). The original investment is $29; therefore, the return on the investment is 41.3%. The holding period is 149 days, almost half of a year. The effective annual return is 101%.
This particular model is an ideal dream. The buy point is well below intrinsic value, and the stock’s price recovered quickly from its low of $26.
A common concern/question raised by students of value investing is: ‘Why not buy the stock after it dips past $28?’ Their point is that, if the stock were purchased at $26, the return on the investment would be $14 on a $27 investment (buy price of $26 plus $1 transaction fee). The final return would equal 51.8%; the effective annual return would be dramatically greater than the 101% from the above example. There are two benefits from this: first, the financial gain is greater on a smaller investment, and the period to complete the full transaction is 35 days shorter. Therefore, the actual and annual return is greatly superior.
There are two problems with this thought. First, the student assumes that the price will continue to drop when there is a good chance that the price dips to $28 (recall the 80/20 rule) and then begins to swing upwards. The idea of waiting means a lost opportunity. Secondly, value investors exercise computer orders in order to reduce their time commitment by constantly monitoring the market. Imagine monitoring eight or ten different stocks, waiting for a good price to buy. One of the benefits of value investing is reduced stress, a direct result of proper planning. Computer directives are a part of planning. Value investors adhere to the adage: ‘Proper planning prevents poor performance’.
This is why this program teaches that value investors will earn good returns; in order to earn great returns, there must be dramatically more risk assumed and increased time invested in monitoring and research.
The above model is an example of an ideal potential investment opportunity. The perfect model would have greater dispersion from the intrinsic value point at a higher frequency (more often). Imagine having a model that allows for 30% deviation from intrinsic, and the fluctuations occur within four months, i.e., the 30% dip to the 30% peak transition in four months. Thus, based on a $35 intrinsic value, the dip to $24.50 ($35 * 70%) would only take about 45 days; the buy is made for a total investment of $25.50. The market price recovery accelerates to $45.50 (130% of intrinsic value) in four months, and the stock is then sold, netting $44.50 ($45.50 less $1 for the transaction fee). Total gain is $19 on a $25.50 investment, which equals a return of 74.5% or an annualized effective return of more than 220%.
Take note, steeper deviations along with shorter time frames dramatically increase the return on one’s investment. It isn’t a slight increase; it is substantial.
These types of models simply don’t exist with the highly stable top 2,000 companies. This is why it is explained in Lesson 14 to design at least three sets of pools that allow a value investor to create multiple models. From Lesson 3, market fluctuations are primarily driven by economic-wide pressures, then industry-wide factors. The goal is to have three or more industries (pools) with varying models such that the deviations are predictable. This then allows for easier setting of buy and sell points.
Go back to the core four principles of value investing. Principle number one is to seek risk reduction. Highly stable, the top 2,000 companies practically eliminate the risk associated with investment. Additional risk aversion is fulfilled by buying the security below its intrinsic value. An investor can indeed find securities with dramatic deviations from intrinsic value and high-frequency fluctuations. These are commonly found with small-cap investments. The trade-off with investing in this part of the market is significantly increased risk. Thus, value investors AVOID small-cap investments, a direct result of risk aversion. It is superior thinking to earn good returns with minimal risk than to increase risk dramatically for potentially a few more percentage points with gains.
When developing a model, try to find and use an industry-wide model as the base for the pool. For example, this is the railway index published by Dow Jones and comprises all six North American railroad companies.
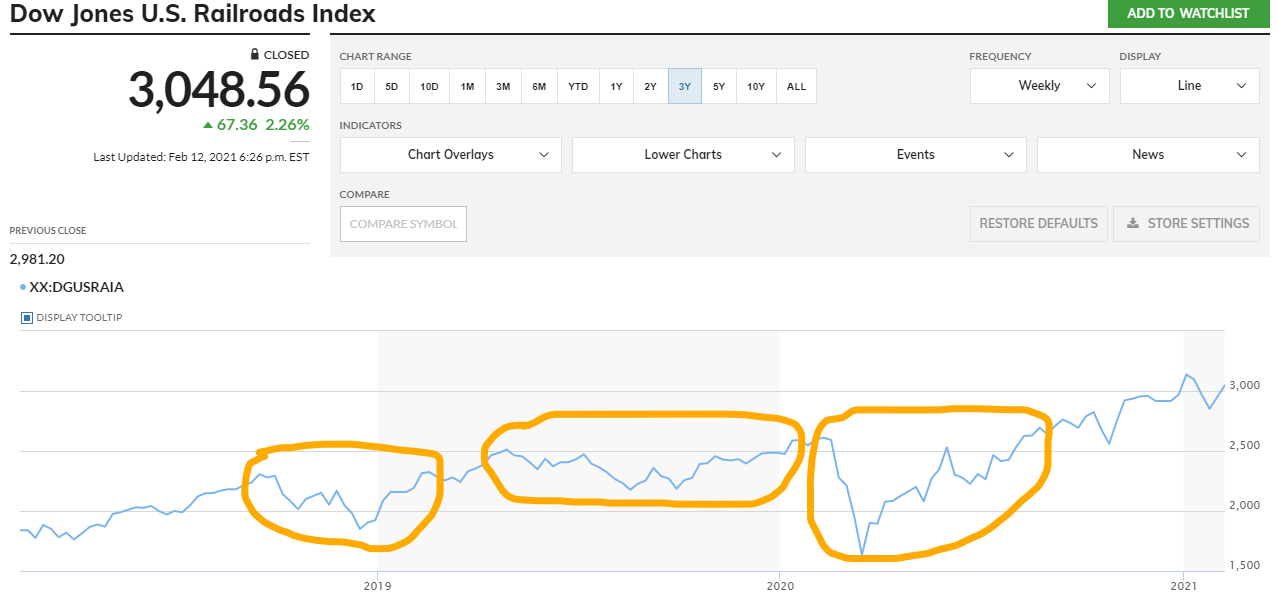
The least differential of extremes occurs with the center circled zone. On 04/28/2019, the index peaked at 2,512, and four months later, on August 18, 2019, it dipped to 2,177, a 13.3% decrease. The key is that there is a pattern of differential values with railroad stocks. There appears to be an annual repetition with highs and lows of more than 13%.
For explanation purposes, assume the intrinsic value of the index fund is 2,300 in 2019. Thus, this would indicate a dip in this time period of approximately 5.4% and a recovery of approximately 109% of intrinsic value.
Many of you reading this will question why this would meet the suggested minimum differential of at least 20% of intrinsic value as the mean value. Therefore, based on this requirement, the only valid differential occurs in 2020, and there isn’t enough frequency to warrant inclusion of railroads as an industry pool of potential investments. The argument is reasonable. The response is informative.
The index fund comprises six railroad investments. During the 2019 cycle period, each of the six had its distinct cycles. To illustrate, here is a table of values, peaks, and dips for each of the six railroads in this index fund.
. Time Period 04/28/2019 thru 08/18/2019
Name Peak Price Lowest Price Differential %
Union Pacific $179.20 $162.45 10.3%
Canadian Pacific $246.27 $216.73 13.6%
Kansas City Southern $125.34 $112.05 11.8%
Norfolk Southern $206.70 $169.85 21.7%
Canadian National $95.37 $88.59 7.6%
CSX $80.52 $64.41 25.0%
Within these six investments, both Norfolk Southern and CSX railroads drove the average price differential of the index fund. Thus, out of the six, two of the investments are potential value investment opportunities. Again, the respective intrinsic value for each investment is required in order to determine if indeed there is an opportunity with that investment.
The point of the above exercise is that the industry index reveals cycles of ups and downs. Secondly, these differentials are for the industry as a whole. Reviewing the individual investments will identify actual opportunities.
With a core model developed for the industry and then with each member of the respective pool, the next step is to set the buy and sell points. A popular tool used is the price-to-book ratio.
Setting Buy and Sell Points With the Price to Book Ratio
The price-to-book ratio is one of the most popular value investor tools used to gain a quick understanding of any company’s financial market profile. As a company gains trust and proves its stability (remember, stability of earnings is considered the number one factor with valuation), its price-to-book ratio will begin to increase.
The price-to-book ratio is defined as the market price per share against the book value per share. The book value is the shareholder’s equity section divided by the number of shares outstanding (sold and held by shareholders). Thus, if the market price is greater than book value, the result is a positive relationship. It is not uncommon for the market price to be less than book value, and yet the company is still a great operation. In some instances, the book value can be negative, yet the investment is considered high quality. A good example of this is McDonald’s Corp. McDonald’s book value is almost $9 per share; yet, it is one of the top 10 most stable companies in the world.
There are circumstances when book value is less than the market price with high-quality companies. But, in general, investors look for positive price-to-book values. The higher the ratio, the more likely it is time to dispose of the investment. In order to determine a potential opportunity, the value investor must first recognize or determine the normal expected price-to-book ratio. Here is an example:
Essex Property Trust is a real estate investment trust with over 60,000 units along the West Coast of the United States. In early 2021, its book value was approximately $98 per share. Its market price ranged from $240 per share to $265 per share during the first two months of 2021. Thus, its price-to-book value ranges from 2.45 to 2.70. The intrinsic value of Essex Property Trust is calculated to be $255 per share or approximately an intrinsic price to book value of 2.60:1. Thus, with this particular investment, it is expected and reasonable to have book values ranging from 2.1 to 3.1 (20% deviation from the intrinsic price to book ratio of 2.6).
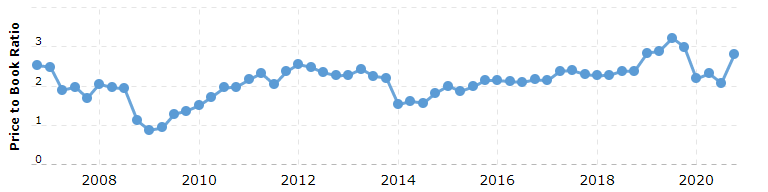
This is not unreasonable with REITs. With banks, ratios greater than 1.5:1 are just unheard of in that industry. To illustrate, here is Bank of America’s price-to-book ratio for 14 years.
Not once in 14 years has Bank of America’s price-to-book ratio exceeded 1.5:1. Bank of America is considered one of the top five banks in the United States. It is a well-respected and well-run organization.
The point here is this: THERE IS NO UNIVERSALLY CORRECT PRICE TO BOOK RATIO STANDARD. Each industry is different, and as a value investor, you must recognize this and accept it as a value investment standard to follow. If you ever hear someone say that the price-to-book ratio is high and that it is common to sell at 2 or 3 to 1, that individual is not sophisticated when it comes to investments. THERE IS NO PRICE TO BOOK STANDARD. Price-to-book ratios have normal ranges within each industry.
This same principle exists with the buy side tied to to book ratio. Many so-called professional investors state that buying at less than book value is the same as value investing. IT IS NOT! It is not uncommon for the price-to-book ratio to be less than 1:1 in several different industries, for example, insurance companies. The Travelers Insurance Company has had eight of the last fourteen years with the price to book ratio at less than 1:1, and Travelers is a DOW Jones Index member.
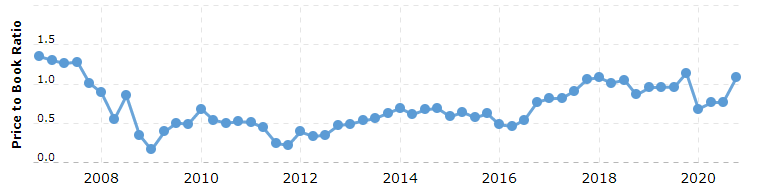
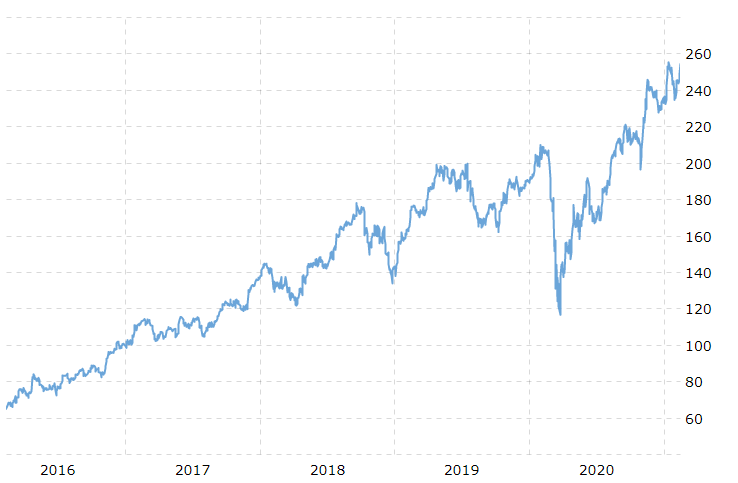
The goal of this exercise is to first understand the industry’s normal price-to-book ratio range and then each member within your pool of potential investments within that industry. Keeping with Essex Property Trust, here is Essex’s price-to-book ratio over the last 14 years.
Notice that Essex’s price-to-book ratio dipped below 1:1 back in 2009. This is a direct relationship to the entire economic recession driven by the mortgage crisis that started in the 2nd half of 2008. The price went over 3:1 in the middle of 2019, just before the COVID market collapse in February of 2020. With a 3.2:1 ratio and a book value back then of $94 per share, the market price was just over $300 per share.
Remember from above, the intrinsic price to book is 2.6:1. Thus, looking at this graph, an excellent buy price is when the price to book drops to 2.4 or 2.3:1. If the current book value is $98, then a good buy price is $225 to $235 per share. Looking at the trend line, the sell point is 2.9, possibly as high as 3.0:1. Thus, a reasonable sell price if the book value is $98 per share is $285 to $295 per share.
The key is to pay attention to current book value, as it does improve from one quarter to the next. Remember, value investors only purchase high-quality, top 2,000 companies. Since stability of earnings is essential to belong to this group, book values should increase from quarter to quarter. There are exceptions to this rule, but in general, book value should improve with each quarter’s financial report for your investments. Since book values improve, the market price for the respective stock tied to to book ratio should also improve quarter over quarter. Thus, the market price standard this quarter will most likely end up less than the desirable amount in the forthcoming quarter.
There is a lot of emphasis on book value in one of the lessons during Phase Two of this program. That lesson teaches the value investor how to read the equity section of the balance sheet and derive book value. It also explains how share buy-back programs impact book value, along with other circumstances that impact book value. Understanding book value and how to monitor this important pricing mechanism is essential as a value investor.
Another tool used to set buy and sell points with a particular investment is the prior peak price point of the security. This particular tool places emphasis on setting percentage changes in order to determine buy and sell points for stock.
Setting Buy and Sell Points Using Prior Peak Price
An alternative to the price-to-book ratio method is using the prior peak price tool. This approach is based on an assumption that the market price for high-quality securities will always be on an upward incline, similar to the DOW Jones Industrial Average. Thus, if a particular company’s stock price hits a new peak at some point in the future, it will surpass this peak price. In effect, buy at a deep discount to the most recent peak price and then simply sell once the security’s price surpasses the prior peak price.
Thus, to earn good gains, the value investor only needs to find securities with an adequate differential between the peak prices and dips in market price within a short period. Here is an example with Norfolk Southern Railroad.
 Norfolk Southern has a distinct incline. Within this incline are multiple points of peak price and a corresponding deep price discount. Here are the four obvious cycles:
- Jan 2018 – price peaks to $150.88 and dips to $135.78 in March of 2018 – 10% change
- Sept 2018 – price peaks to $180.50 and dips to $149.54 at the end of Dec 2018 – 17% change
- April 2019 – price peaks to $204 and dips to $174 in August of 2019 – 14.7% change
- Jan 2020 – price peaks to $208.21 and dips to $146 in March 2020 – 29.8% change
In a course of two years, there are four full cycles of at least a 9% decrease in value from a prior peak. This site’s investment fund took advantage of three of these distinct cycles to earn excellent gains. This site set the price decrease to 12% of the prior peak and the sell point to 103% of the prior peak and reaped good gains for each full cycle.
The key is that there is a definite pattern with this particular company, and recovery from a trough point along the price spectrum is short and always surpasses the prior peak market price. Why? This company is highly stable and provides weekly updates to its key performance indicators. In effect, it is a highly stable and well-run company. Any negative deviations are simply the result of an industry-wide issue or some kind of temporary falling out of favor with the market as a whole. This same pattern has existed for the last 20 years. With this site’s railways pool, this particular company is an automatic buy at a 12% dip in market price from the prior market peak price, and then sold at 103% of the prior market peak price.
An important critical piece of the formula is the intrinsic value line. The line should have a similar incline as the market’s trend line over time. Do not allow the separation of the intrinsic value from the market’s trend to deviate more than 5%. A greater than 5% deviation will cause greater disparity with price fluctuations and will require a deeper discount with market price to protect against a protracted recovery period. In effect, deviation from normal warrants additional security to protect the investment and increase the final reward for this additional risk.
This particular method is only appropriate for investments that demonstrate a pattern, as Norfolk Southern’s share price illustrates. Furthermore, it is of the utmost importance to validate that the company is well managed and that it isn’t suddenly changing its operational standards or product/service lines. With railways, changing the model is difficult, if not impossible. Thus, the highly stable pattern exists.
One last important note related to this particular method of buying and selling securities. Sometimes the prior peak is an anomaly. Be careful, look at the historical pattern; the prior peak should be on the incline path; in effect, it was predictable. If the prior peak is a spike that is more than 15% off the predicted high, gain an understanding of the underlying forces that cause this abrupt increase. If the underlying factors are permanent, the market may be elevating the entire industry due to a change in the industry or the economic sector. A good example is pharmaceuticals in late 2020. Worldwide governments started negotiating contracts with them to provide vaccines. There does not seem to be any reason to believe that this will not continue, as new vaccines will be required each year to keep up with the variants of this virus. Thus, pharmaceuticals have been elevated to a higher tier of overall value in the eyes of the world economy.
To counter this, an example of a stock that has had a sudden increase in market price is Tesla. There is no industry, company-wide wide nor economic justification for this doubling of stock price in six months. In effect, Tesla’s $800 per share market peak in price is unjustifiable and quite simply, unreasonable to maintain or continue increasing along the same incline. It simply does not make sense.
A third method of setting the buy and sell points is to base the values on earnings per share.
Setting Buy and Sell Points Based on Earnings
Throughout Phase One of this program, it has been reiterated many times in the lessons and in articles about particular investments that the stability of earnings is the number one factor related to value for any company. Stability of earnings refers to three required characteristics of a company’s earnings.
First, the earnings must be positive for an extended period of time. The more history of positive earnings, the greater the reliance on the company to earn a profit in the future. An extended period does not mean five or even seven years. It means positive earnings for a complete economic cycle within the industry the company operates. For most industries, this means at least a dozen, possibly as many as twenty years of continuous positive earnings.
Secondly, the historical earnings pattern must be growing from one year to the next. A good example is Canadian National Railway. Here are Canadian National Railway’s earnings per share over the last fifteen years.
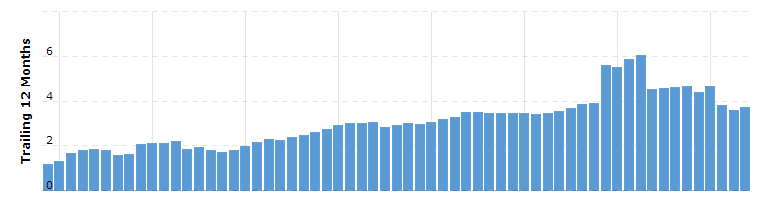 The increase in 2018 is a direct result of the change to the United States tax rate from 34% to 21%. The company elected to include deferred income into that year’s income and pay the tax at a much lower rate as allowed by law.
For this company, earnings per share per quarter are consistently on an incline over time. The last three quarters reflect the impact of COVID (quarters 2, 3, & 4 of 2020).
This graphical depiction validates the stability of earnings. This is the ideal pattern for any publicly traded company.
Finally, the company must demonstrate positive earnings during a recession. Since the stability of earnings is based on a full economic cycle for the respective industry, from the graph above, Canadian National demonstrates this twice in this fifteen-year depiction. Back in 2008, which is depicted at the seventh and eighth markers (notice the slight decrease with these two earnings per share indicators), a recession started in North America. A second recession occurred during the last half of 2020, driven by COVID, as evidenced by the last two markers in the above graph. Canadian National continues to earn positive earnings per share during two distinct economic recessions.
Stability of earnings is the most critical factor in deriving value.
When setting a buy and sell point for any stock, earnings per share can be used to determine these two points. A popular ratio used to assist with this outcome is the price-to-earnings ratio. In theory, a company should hold steady with its price-to-earnings ratio (P/E). As its earnings increase, the market price per share should increase in a similar pattern as if the two units of measurement had a correlation rate of a natural price-to-earnings relationship. A good example of this is Amgen Inc. Amgen is a biotechnology company and a member of the DOW Jones Industrial Index. Take a look at its earnings, price per share, and its P/E ratio.
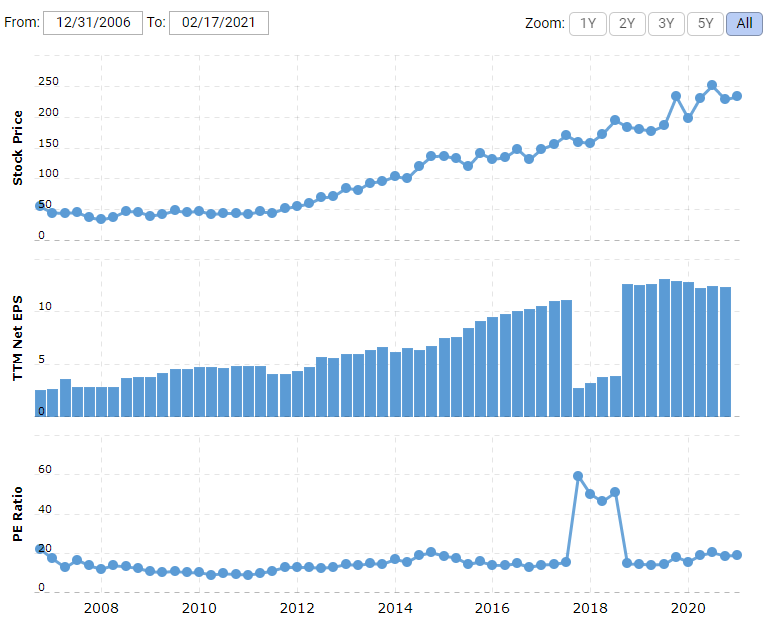
Other than the anomaly in 2018 due to the tax code implications on earnings, the P/E ratio remains relatively stable even though the stock price increases. There is a good correlation between the increasing earnings and the stock price, keeping the P/E ratio stable. Notice that even though the earnings dip due to the taxation recapture, the stock price did not drop in a similar pattern. This is because investors were well aware of the tax implications when Congress passed the Tax Act in December 2017. However, if the market price for a share remains stable and the earnings practically collapse, it does indeed impact the P/E ratio. The result was a tripling of the outcome ratio.
However, this isn’t true for all companies. Amgen is one of the few companies that adheres to the correlation theory for price and earnings. Other market forces, including industry issues, can cause the P/E to fluctuate even though the company continues to prove its ability to earn profits with consistency and improvement over an extended period of time. Take a look at Canadian National Railway’s P/E ratio over the same period as the above earnings graph for Canadian National.
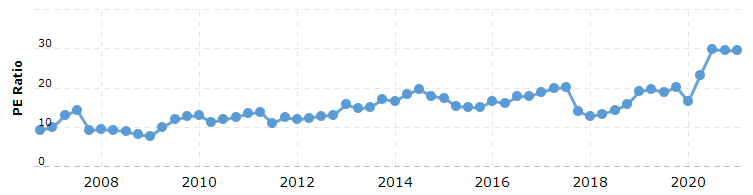
The P/E ratio fluctuates, and its pattern is not level. This is how value investors can take advantage of the P/E ratio and set buy and sell points for a stock security.
How is this done?
To start, the value investor must know the intrinsic value. With this value, an intrinsic-based price-to-earnings ratio can be calculated. As with all intrinsic formula calculations, use no less than five years ‘ worth of data to determine an average.
For Canadian National, the average annual earnings were $4.57 adjusted to exclude the tax benefit in 2018. The historical average P/E for the S&P 500 has been 15:1. With railways, an intrinsic price multiplier is 18:1. Using this ratio as the mean, Canadian National’s intrinsic average would be $82.26. Over the last five years, it has traded for a low of $48 and a high of $116.
If an investor wants to add additional security with their investment, they would simply lower this ratio to 17:1. Thus, whatever the average five-year earnings are, a buy is set for any price less than 17:1, and a sale is conducted at 23:1 or higher.
With Canadian National Railway, the current buy price using this method is $78 per share, and the sell price is set to $105. As of the writing of this lesson, the current market price for Canadian National is $108 (02/17/2021). During the past 12 months, the low has dipped to $66 per share, and its high reached $116 per share.
Each quarter, this buy/sell trigger formula is recalculated to reflect the impact of the most recent earnings. However, the intrinsic value earnings multiplier never changes; refer back to the correlation theory of market price to earnings.
* Caution
For those of you interested in reviewing Canadian National’s quarterly or annual financial reports, please be aware, their financial statements are in Canadian dollars, also known as the ‘Loonie’, named after the national bird, the loon. Thus, you must convert their financial information to US dollars to compare against other years or companies.
Join the Value Investment Club This site's Value Investment Club (Membership Required) utilizes a Value Investment Fund model with an annualized 23.3% return over a SIX and THREE QUARTER-YEAR history. It has grown from a starting basis of $100,000 and is now $411,989 before taxes of $91,166. This is a 19% annualized return after taxes. Membership provides instantaneous access to time-sensitive information. Membership provides: Value investing, in its simplest terms, means buying securities at a low price and selling them at a higher market value. Value investing is defined as a systematic process of purchasing high-quality stocks at an undervalued market price, quantified by intrinsic value and justified through financial analysis, then selling the stock promptly upon market price recovery. Membership gives the reader full access to all information on this website. Act on Knowledge.
Summary – Setting Buy and Sell Points for Financial Securities
This lesson’s primary principles are as follows:
When setting up or designing buy and sell values for any financial security, a core industry model must be created and used as the standard to follow. Each industry will have its value differential around a core intrinsic amount. In addition, this model will identify a common frequency for these maximum and minimum price fluctuations. With this model in hand, the value investor can then proceed to create a unique buy/sell model for each potential investment within that pool of similar investments.
Value investors may use one or more of three very popular methods:
- Price to Book Ratio – as stated multiple times, each industry has its average price to book ratio and a corresponding corridor of values tied to the price to book ratio. Remember, there is no universal standard for to booking ratio. In some industries, it is normal and acceptable to have price-to-book ratios less than 1:1.
- Prior Peak Price – highly stable, top 2,000 companies have a strong history of stable earnings; their respective securities price will also improve over time. A good method is to discount a prior peak price by a substantial discount, buy at this discounted price, and then resell once the prior peak price is surpassed at a reasonable point, like 103% of the prior peak.
- Price to Earnings Ratio – since the market typically prices stock tied to earnings, it uses a price to earnings ratio to determine value. A value investor determines the intrinsic value multiplier and uses the average of at least the last five years of earnings adjusted each quarter, and then determines the current buy and the corresponding sell price based on this single multiplier number.
Good value investors will use all three tools to establish a limited range (corridor) of buy and sell points and adjust these two points each quarter as each company releases its respective financial updates. Act on Knowledge.