
Monitoring Performance (Lesson 17)

I think it is an immutable law in business that words are words, explanations are explanations, promises are promises – but only performance is reality – Harold Geneen.
Monitoring performance is the single best tool to ensure success with value investing. Comparing results against expectations provides the basis for good decisions. In business, this is known as the feedback loop. In effect, a variable input is changed, results are recorded, compiled, and reported in an understandable format. Any unexpected results are analyzed, and input changes are implemented. The pattern is repeated. The end goal is to generate continuous improvement. With business, improvement is stated in the form of profit; with investment funds, it is stated in the form of a percentage of return on the overall invested capital. Thus, managing an investment fund is just like operating a business; the goal is to improve overall performance.
Throughout this series of lessons in Phase One of the program, it has been stated and reiterated several times. The goal of value investing is to generate returns that far exceed the returns of several indices. A value investor should expect at least a return on their investment in the mid-twenties as a percentage per year. The real goal is to generate 30% plus with returns. If the investor does their research properly and adheres to the four principles of value investing, achieving 30% plus per year on average is doable. But without monitoring the performance of the fund, an investor cannot make the necessary timely adjustments to achieve the annual goal.
There are three different levels of monitoring with an investment fund. The primary level includes the decisions and status of the respective buy and sell points for each transaction within the investment fund. Here, the goal is to ensure that each respective company-level purchase adheres to the respective parameters of their pool’s buy/sell model. How is each position performing? The next level is at the pool level. Similar to the respective investment level activity, at the pool level, the goal is to understand how the pool is performing against the initial conception for the upcoming period of activity. Is the pool of similar investments complying with or meeting the goals set at the beginning of the investment year?
The final level is for the fund as a whole. Here, the idea is to understand how each of the respective forms of realized earnings is performing against total earnings (realized and unrealized). Furthermore, it is important to break down progress against anticipated areas of anticipated revenues, including dividends, options, and finally gains from the sale of actual securities.
Throughout this lesson, the investor will refer to this spreadsheet to understand how this works. If you are a member of this site’s program, the spreadsheet is a simple download using your password. For those readers who are not members, you will have to refer to the screenshots provided along with some examples included here in the lesson. The key is that the formulas are built into the spreadsheet for members, making it a lot easier for them to understand and to use this spreadsheet for their purposes.
Monitoring Performance – Primary Level of Data
With value investing, it all starts with creating the industry model. This table of information provides the basis for the buy and sell decisions that an investor will set as the standard of performance. The model itself has its own set of building blocks, which are covered in Phase Two of the membership program. Those building blocks have their respective concepts, formulas, and spreadsheets to use. Those resources are provided with their respective lessons.
The value investment industry model is the outcome. This is the guidance piece of the overall puzzle. To illustrate, here is the railways pool model. There are six publicly traded railways in North America. Each has its own current market price, book value, and intrinsic value. Review all six for these respective dollar amounts. Please note, this is the March 2021 report.
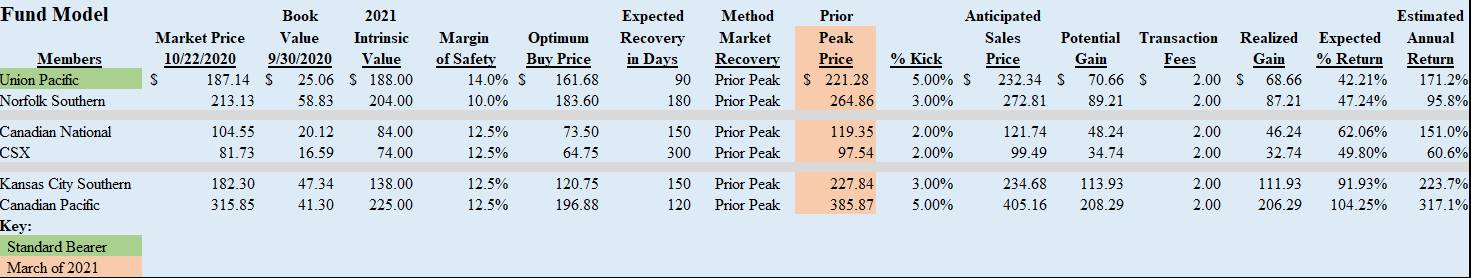
This fund model has several interesting key points.
- At the time of this lesson creation, every single one of the potential investments in the railways pool is at or near its historical peak price. This lesson was written in late March 2021; thus, the Prior Peak Price column reflects current market prices for the individual companies. More interesting is that on Monday, the 22nd of March, Kansas City Southern jumped another $25 per share do to an announcement by Canadian Pacific to buy and merge with Kansas City Southern. Even as a combined company, their volume of revenue ton miles will still be less than one-half of Union Pacific. This is why Union Pacific is marked as the standard bearer.
- Market price on 10/22/2020 indicates the market price as of the start of the fiscal year for this respective pool of potential investments. The prior peak price merely represents the most recent peak in price for the stock during the current fiscal year.
- Optimum buy price is the current year’s desired purchase trigger. The optimum buy price reflects the margin of safety desired from intrinsic value.
- Intrinsic value in the railways industry is calculated using a modified discounted cash flows formula (covered in Phase Two of the program).
The model is the most important part of the industry pool. When developing the model, the investor typically discovers patterns about the individual companies and uses those patterns to fine-tune the model. In this case, this particular pool of investments typically has excellent results. The problem is that having opportunities to purchase low occurs infrequently. Over the last two years, a total of seven opportunities to buy low have existed. Each opportunity was recorded, and every single one of them performed greater than the model predicted.
To date, in Fiscal Year 2021, there have been two opportunities to buy low, and both transactions generated outstanding gains. Look at the results:

Notice how the annualized return for Norfolk Southern far exceeded the expected annualized return that the model sets. Norfolk Southern’s transaction far surpassed the expected due to its short turnaround time of only 13 days. Union Pacific’s transaction almost hit the usual 90-day recovery, and this is why its annualized return was only slightly better than what was projected at that time.
One last note, Norfolk Southern’s purchase at $202.49 per share was only at about 1% margin of safety and not the desired 10%. The investment pool manager decided to make the purchase just under intrinsic value because there were no holdings at all during the last week of October. The pool had not held a single investment in over a month. Once one of the potential investments finally had a share price below intrinsic value, the pool’s decision maker decided that owning Norfolk Southern for a smaller overall projected gain was worth the risk. Furthermore, four of the other potential investments were indicating recovery, which meant that the likelihood of Norfolk Southern continuing to decline to the margin of safety buy price was unlikely. It turns out that Norfolk Southern’s share price only dipped to $198 before it rebounded and cleared its prior historical peak. Thus, intrinsic value is the worst-case scenario for buying the respective potential investment.
With each full transaction (buy and sell), the pool’s overall value should begin to increase. In addition, any investment currently in a ‘hold’ status waiting on recovery after purchase requires monitoring. Thus, a second level of monitoring is required. This is the industry pool level.
Monitoring Performance – Industry Pool Level
At the pool level, monitoring performance is about tracking the status of the respective investments in that pool. The current status is compared against the goal. The idea is to understand how the pool stands in relation to the overall objective. When the investment is made for a particular member of that pool, it is then included in a current portfolio of investments and updated monthly to identify progress towards the projected recovery point.
To illustrate, here is the report for the Real Estate Investment Trust Pool of this site’s Value Investment Fund.
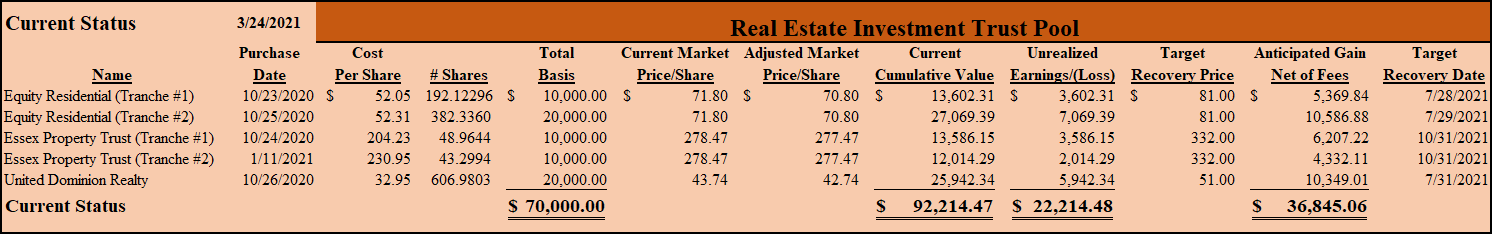
Take note of what this report reveals:
- The pool’s current cumulative value is well ahead of schedule; it is currently five months complete, and all of the respective investments are either on schedule or ahead of schedule for their respective target earnings. For example, with four months to go, Equity Residential is tracking almost in line with the desired outcomes. This is a reflection of the quarterly reports. There are two more quarterly reports to go before the end of July 2021. It is conceivable that the market price will hit the target price of $81 per share when the 1st quarter report for 2021 is posted at the end of April 2021. If that report identifies normal earnings, then the market price will soar. If tenant payments are still an issue tied to COVID, then the price will not hit that target price of $81 until after the 2nd quarter report.
- If all investments hit their respective targets by the respective goal dates, the respective return on investment will exceed 52% not counting dividend earnings during this period.
To augment the current status report, a second report is also included on the same page in the spreadsheet. Dividends earned and expected during the holding period are quantified and reported. This is an example of the report for the REITs Pool.
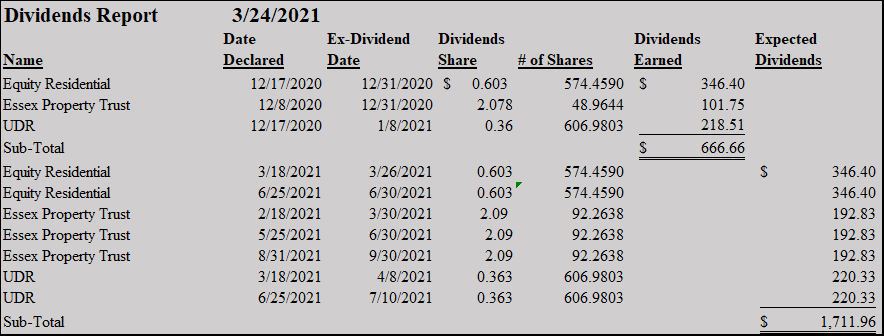 Take note, already fiscal year-to-date, the REITs Pool has earned $666.66from dividends and is expected to earn another $1,711.96 if the respective investments are held through their respective anticipated recovery dates.
Add this cumulative $2,379 to the anticipated gains, and this set of investments should earn a cumulative $39,224, a 56% return on the $70,000 basis. This is well more than reasonable return guidelines for value investors.
The pool is tracking very well towards its end goal. By mid-April, the first quarter dividends will post, adding another $666.66 to realized returns.
Remember, dividends are not the primary purpose of value investing. It is about earning respectable gains within a reasonable period of time. Dividends are just icing on the cake. Overall, auxiliary sources of income such as dividends, interest, and the sale of PUTs typically increase the return by about 10% above gains. Thus, if a fund earns a total 35% return in one year, about 3.5% is sourced from these auxiliary sources. Gains will typically represent about 90% of the total return over time.
The final level of reports sums up all the respective pools onto one tab in a spreadsheet.
Monitoring Performance – Investment Fund Level
At the investment fund level, the format is a summary presentation of each of the individual pools’ current status tied to the existing investments. In addition, a second section reveals realized gains from each pool. A third section identifies the auxiliary forms of earnings fiscal year to date, including dividends, sales of any options, and interest. The summary line indicates total unrealized gains, realized gains, and current balance of the investment fund. This section of the investment fund level will also identify the current positions along with any dividends receivable and cash balance.
The following is an illustration of how this site’s Value Investment Fund is presented to members for learning purposes.
VALUE INVESTMENT FUND
Status Report – 03/24/2021
Current FMV Unrealized
Industry Pool Investment Basis Net of Fees Gains/(Losses)
Railways -0- -0- -0-
REITs $70,000 $92,214 $22,214
Banking 40,000 41,889 1,889
Sub-Totals $110,000 $134,103 $24,103
Realized Gains
Railways $7,298
Banking 3,677 Realized
REITs -0- Earnings
Sub-Total $10,975
Dividends Earned
Railways 204
REITS 667
Banking 409
Sub-Total 1,280
Sale of PUTs
Railways 3,361
Sub-Total Realized Earnings Fiscal Year-To-Date $15,616
Receivables (Dividends/Broker Amounts) -0-
Cash Account 5,617
CURRENT DOLLAR BALANCE – VALUE INVESTMENT FUND $139,720
INITIAL INVESTMENT BASIS 10/22/2020 $100,000 $39,720 (Realized & Unrealized Gains)
When reading this report, remember, realized earnings are reinvested into other potential securities. In this, $10,000 of the earnings have been reinvested as the cost basis up as the industry pools section reveals a current cumulative investment of $110,000. The Fund started with $100,000. The difference is in the form of cash; with most reports, the difference will be in the form of receivables and cash.
Thus, this fund has increased in value by $39,720 through the first five months of activity.
Join the Value Investment Club
This site's Value Investment Club (Membership Required) utilizes a Value Investment Fund model with an annualized 23.3% return over a SIX and THREE QUARTER-YEAR history. It has grown from a starting basis of $100,000 and is now $411,989 before taxes of $91,166. This is a 19% annualized return after taxes.
Membership provides instantaneous access to time-sensitive information.

Membership provides:
- Email Alerts for any pending transactions or actual activity for this site's Value Investment Fund; members may want to mimic the transaction activity for their personal investment fund.
- Monthly Newsletter regarding the activity within the Value Investment Fund;
- Quarterly Spreadsheets for each active pool of investments with this facilitator's calculated intrinsic value, buy and sell points;
- Weekly Article regarding one of the 60-plus potential investments outlining the respective business dynamics, issues, standards, and calculated buy/sell matrices;
- Watch Notices for possible opportunities along with suggested buy and stop loss points.
Value investing, in its simplest terms, means buying securities at a low price and selling them at a higher market value. Value investing is defined as a systematic process of purchasing high-quality stocks at an undervalued market price, quantified by intrinsic value and justified through financial analysis, then selling the stock promptly upon market price recovery. Membership gives the reader full access to all information on this website. Act on Knowledge.
Summary – Monitoring Performance
Monitoring the performance of a value investment fund is essential for several reasons. First, it is important to compare results against the designed buy/sell model for each respective industry pool. Secondly, understanding the current fair market value of each industry pool and the dollar value of each holding within that pool allows the investor to understand how the respective investments are tracking against the goals set forth. Finally, an overall picture informs the investment fund manager about the current status of the fund overall, where it has earned its gains and other sources of net realized earnings. This allows the investor to compare the fund’s status against the respective goals set out at the beginning of the year. Act on Knowledge.