
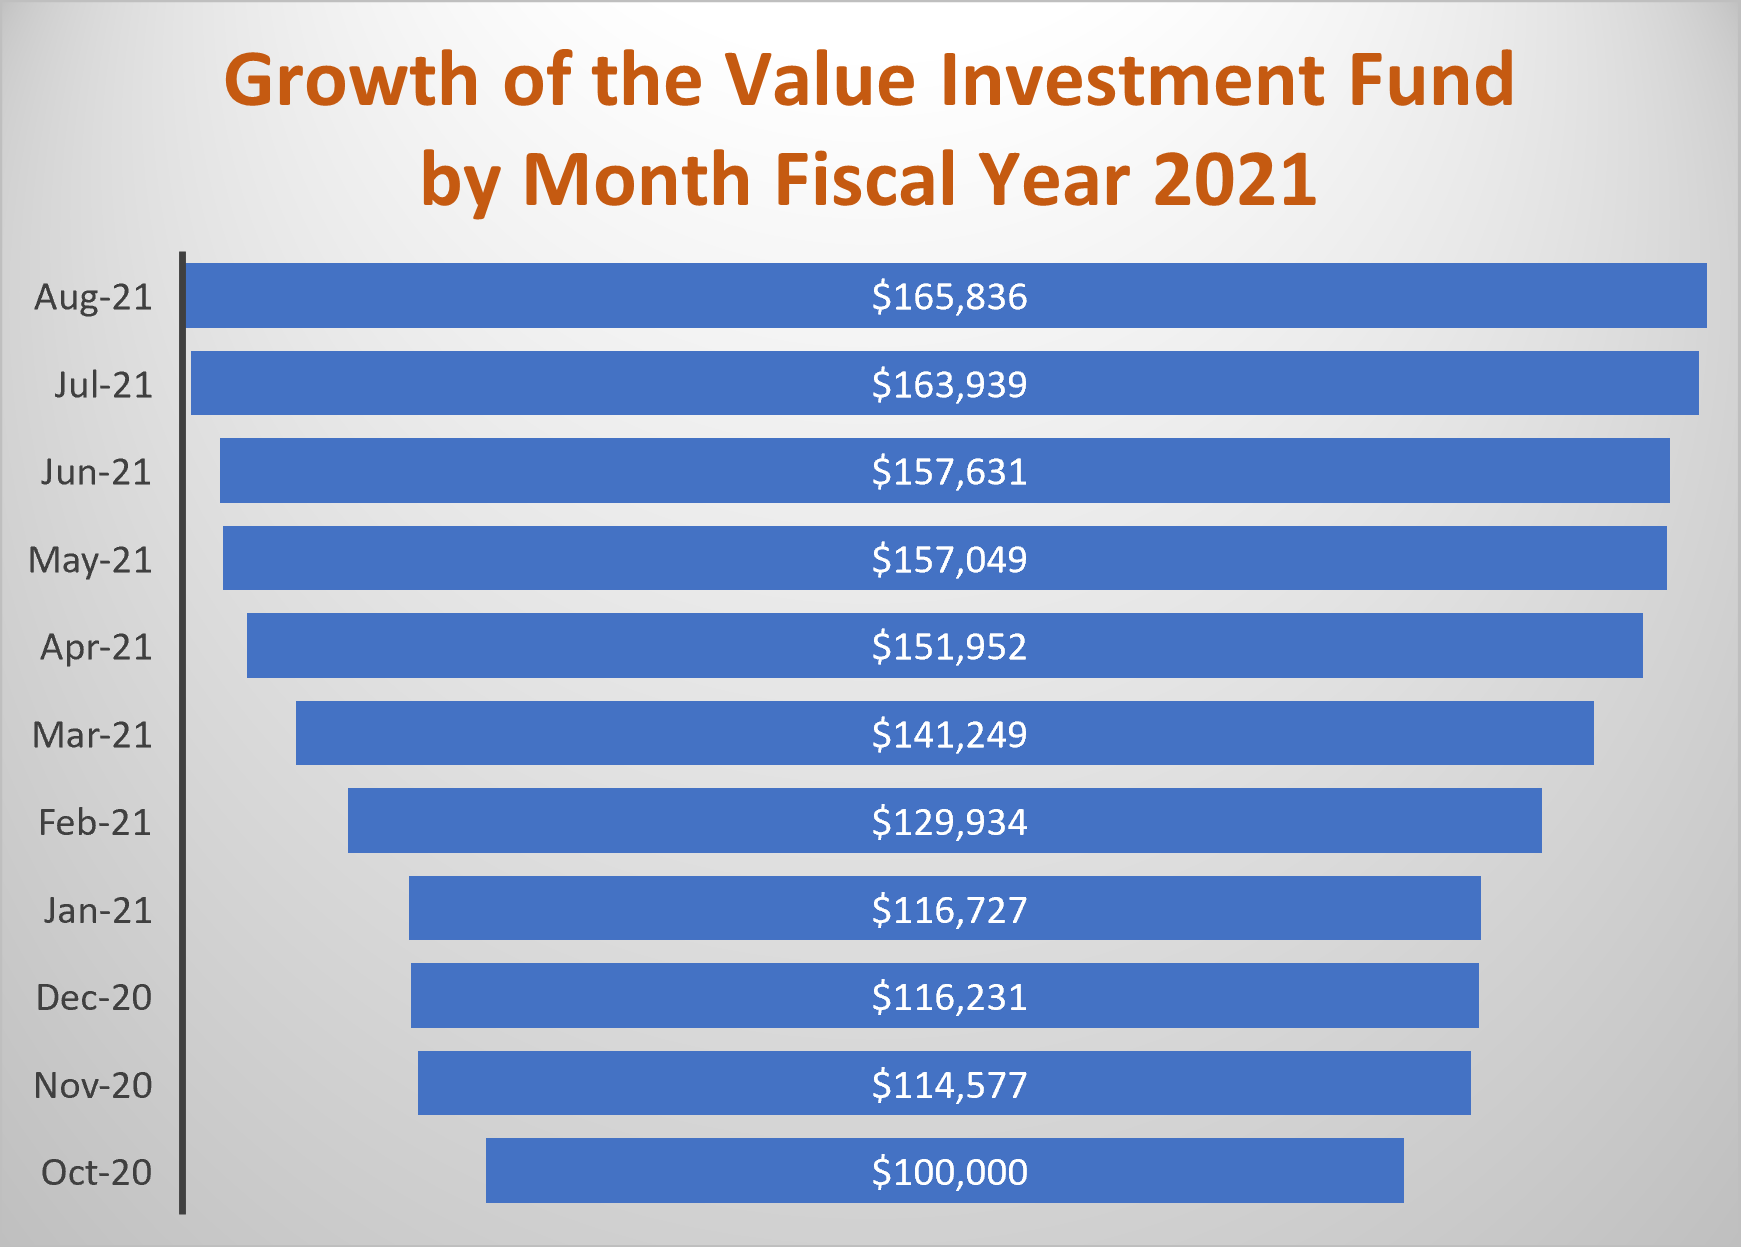
Value Investment Fund – Status on August 31, 2021

“And when the wind did not blow her way, she adjusted her sails” – Elizabeth Edwards.
Although the Value Investment Fund continues to grow, opportunities wane. It has been smooth sailing so far, mostly due to an economic downturn in 2020 driven by COVID. Opportunities still existed into late 2020, of which this Fund took advantage. Now I have to add more potential opportunities, or growth will amble along. There does not appear to be any storm activity shortly. The market indices are all at their all-time highs; there are no negative outlooks from any authority, and quite honestly, economic forecasts look robust. Without an economic wide storm, very few potential buyers will exist. To counter this, the Fund must expand its selection of pools and the corresponding high-quality companies in order to take advantage of an individual company or two falling out of favor with investors.
As stated multiple times throughout the lessons and tutorials, high-quality stocks have less risk and thus, resist remarkably well when the market goes down or is stagnant and recover quickly upon market rebound. Furthermore, high-quality stocks provide many opportunities to earn good rewards if properly purchased at less than intrinsic value and sold upon market price recovery.
Here is the Value Investment Fund’s status report for the end of August 2021.
Value Investment Fund – End of Month Report
. August 31, 2021 July 31, 2021 August 31, 2021
REIT Pool # of Shares Cost Basis Market Price* Fair Market Value* Fair Market Value*
– Equity Residential 574.459 – – Sold
– UDR 606.9803 – – Sold
Railways Pool
– No Stock Holdings (All six railroads are at or near their all-time highs)
Banking Pool
– Bank of New York 232.9373 – – 11,723.73 Sold
. – Wells Fargo (Tranche #1) 292.0560 10,000 45.70 13,125.00 13,346.96
. – Wells Fargo (Tranche #2) 558.9715 20,000 45.70 25,120.18 25,545.00
. – Wells Fargo (Tranche #3) 234.3292 10,000 45.70 10,530.75 10,708.84
. Sub-Totals 40,000 60,499.66 49,600.80
Dividend Receivables (Wells Fargo) 79.20 217.07
Cash on Hand (Basis, Gains, Dividends, PUTS) 103,360.22 116,018.03
Totals (Starting Cost Basis = $100,000) $40,000 $163,939.08 $165,835.90
*Net of transaction fees of $1.00 per share; thus, the amount in the schedule equals the actual market price per share at closing, less $1.00 per share.
On August 12th, the Fund sold 232.9373 shares of Bank of New York, netting $54 per share after transaction fees. Net gain earned was $2,578.61. This equates to an annual return of 47%. The original basis invested was $10,000 back in late January 2021.
Value Investment Fund – Activity
During August, the following transactions occurred.
- Dividends were recorded for Wells Fargo for $217.07;
- Sold Bank of New York for a realized gain of $2,578.61.
To date, the fund has realized earnings as follows:
Gains
Gain on sale of Norfolk Southern $2,678.26
Gain on sale of Union Pacific Railroad 4,620.06
Gain on sale of Comerica Bank 3,677.40
Gain on sale of Essex Property Trust (06/18/21) 7,863.67
Gain on Sale of Equity Residential (07/15/21) 17,105.64
Gain on Sale of UDR (07/12/21) 10,956.00
Gain on Sale of Bank of New York Mellon (08/12/21) 2,578.61
Sub-Total Gains $49,479.64
Dividends
Norfolk Southern (Nov) 92.39
Union Pacific (Dec) 111.50
Equity Residential (Dec/March/June) 1,039.20
Essex Property Trust (Dec/March) 294.58
Comerica Bank (Dec) 251.57
UDR (Jan/April/July) 658.87
Bank of New York Mellon (Jan/May/July) 223.62
Wells Fargo (Feb/May/August) 387.27
Sub-Total Dividends $3,059.00
Sale of PUTs
Expired PUTs (See Prior EOM Reports for List) 1,592.16
Union Pacific (Feb @$155/Sh) Expires January 20, 2023 1,769.23 – Market price is currently at $218.76.
Norfolk Southern (March @$190/Sh) Expires January 21, 2022 335.07 – Market price is currently at $256.16.
Sub-Total PUTS $3,696.46
Total Realized Earnings $56,235.10
Total dividends earned in Year Two year-to-date equals $3,059.00. Realized earnings and dividends receivable plus $60,000 of the original $100,000 of basis equals the total capital available ($116,235.10) for investment in other securities. In effect, the Fund now has a very strong cash position of $116,018.03. Almost all of the available options for investment are at or near their all-time highs. Thus, without more available selections, the Fund will have difficulty with good returns in 2022. Act on Knowledge.