
Lululemon Athletica Inc. – Purchased 300 Shares
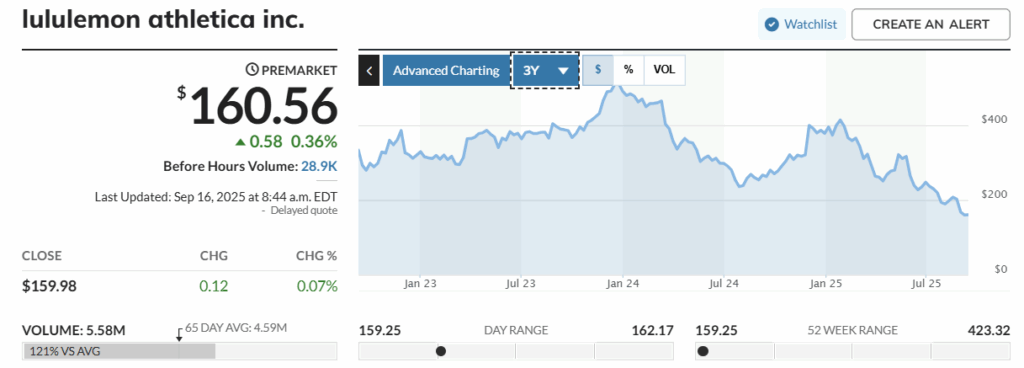
Lululemon’s market price is now less than $161 per share as of 09/15/25. Over the last 36 months, the market valuation has dropped dramatically from a high of $511 per share in December 2023 to just under $161 on 09/15/25. The Value Investment Fund purchased 300 shares of Lululemon Athletica Inc. to add to its portfolio.
![]()
The fund purchased 300 shares at $160 each with an additional cost of $1 per share for transaction costs. Total investment is as follows:
Lululemon – 300 Shares @ $160/Each $48,000.00
Transaction Fees – $1/SH 300.00
Total Basis $48,300.00 ($161.00/Share)
Lululemon is currently NOT issuing dividends. The Value Investment Fund has the following value points:
- Book Value $36.88/Share
- Gross Profit Margin 58.41% *Outstanding, was at 57.6% at fiscal year end 2022.
- Earnings per Share $11.30 *Estimated for 2025, $14.67 (2024), $12.20 (2023), $6.68 (2022)
- Total Debt Ratio 43.12% *Includes current liabilities
- Profit Schedule:
- Six Months to Date 2025 $685 million
- 2024 $1,814 million
- 2023 $1,550 million
- 2022 $855 million
- 2021 $975 million
- 2020 $589 million
- 2019 $646 million
- 2018 $484 million
- 2017 $259 million
- 2016 $303 million
- 2015 $266 million
- Intrinsic Value $183/Share
- Discount Factor 12%
- Buy Price <$160/Share
- Sell Price >$320/Share
- Expected Time Frame – 2 Years to Recover to $320/Share
- Anticipated Return on Investment at Two-Year Point – 40% Annually
Since going public back in 2007, Lululemon has yet to lose money. The company has a strong balance sheet in comparison to other retail giants. Furthermore, the gross profit margin is one of the highest within the retail sector. The gross profit margin is one of the most critical key performance indicators when determining intrinsic value. Another driver of lower discount rates is debt.
Value Investing – Key Concept (Debt)
Debt is a risk factor when determining value. The stronger the debt ratio against tangible assets, the higher the risk involved and the requirement to utilize increased discount factors when determining intrinsic and buy values for securities. Ratios of more than 75% are considered the transition points for increasing discount rates at an ever-increasing rate. There are exceptions to the rule; strong cash flow operations such as REITs and fast-food restaurants allow for higher ratios. For example, McDonald’s has more debt than assets. Yet, its cash flow is so strong at $10 per share that the company can easily pay 60 cents on the dollar of earnings and still service its debt. McDonald’s is simply a gold nugget amongst debt-heavy companies. REITs have strong cash flows, allowing for payouts of dividends at 90 cents on the dollar of earnings (a requirement to maintain their tax-free status). Here’s a quick look at Lululemon Athletica Inc.’s long-term debt to tangible assets ratio at 06/30/25:
Total Assets $7,603 million
Less: Intangible Assets (171 million) *Includes Goodwill
Tangible Assets $7,432 million
Long-Term Debt $1,342 million *Almost 95% lease obligations
Long-Term Debt to Tangible Assets Ratio = 18.1 %
Act on Knowledge.
This investment has all the characteristics that this site’s facilitator advocates. A historical low market price, a solid company with a good history of earnings and stability, an excellent debt ratio, a reasonable discount rate reflecting a top 2,000 company, and a strong, quick recovery time frame forecast. Act on Knowledge.