Principle #3: Financial Analysis (Lesson 8)

Changing the direction of a large company is like trying to turn an aircraft carrier. It takes a mile before anything happens. And if it was a wrong turn, getting back on course takes even longer – Al Ries.
Large behemoth corporations are like aircraft carriers; given their enormous size, it takes tremendous amounts of resources to stop or even slow them down. In addition, if you want to change their trajectory even slightly, it still takes significant energy to implement this course correction. This is why highly stable organizations such as the top 2,000 companies can maintain their profitability. Their missions are figuratively set in stone. Any desire to add or delete product lines or implement new processes must go through a rigorous review by multiple levels of management before implementation. The thinking is simple: ‘Why change a good thing?’.
Thus, the number one overall force that impacts the stock price of large corporations is the economy as a whole. The DOW companies are greatly affected by the economy, and rarely are their stock prices directly tied to a failure within their overall corporate organization. This was covered to some extent in Lesson 3 about market fluctuations. In addition, industry-wide issues impact a company’s stock price more than the company’s financial results. A perfect example is the oil industry. Middle Eastern political actions often affect an oil company’s stock price to a greater degree than the company’s internal financial results when reported.
This leads to the usefulness of financial analysis generated for value investors. It sets up a predictable and reasonable market price for the respective stock. This becomes the sell price point or what is often referred to in this series of lessons as the recovery point. If all three forces (economic, industry, and company level) are performing reasonably, then the stock price for the company will recover to this sell point. Therefore, value investors need to understand the importance of knowing financial analysis.
Financial analysis is an assessment of a company’s performance in the form of dollars. The goal is to establish a trend line of financial accomplishments. It is safe to assume that the historical results can predict future results with accuracy. Again, large corporations are money-generating machines; it will take several adverse actions to slow down or diminish their ability to earn profits.
Financial analysis starts with gathering research data, specifically annual and the most recent quarterly financial reports. With this information, certain data is loaded into a spreadsheet so that ratios can be derived. With spreadsheet data, trends are tracked and from there, summarized. This summary of pertinent outcomes assists the value investor in determining the most likely outcomes for the next several quarters. Take note, value investors are not as interested in extended time frames, as this methodology is designed to determine an expected recovery value for the stock. Value investors are not interested in holding to collect dividends; they are interested in the buy low, sell high tenet of business. Thus, long-term expectations are irrelevant.
Other key information is extracted from the quarterly and annual reports to confirm trends, validate business ratios, and finally, determine the expected market recovery price.
This lesson first introduces the member to data gathering, i.e., where to go to get the information necessary. In the second section below, certain key financial points are essential to understand; this section will cover the five most important bits of data and why they are so instrumental in having a fundamental understanding of financial performance. The third section illustrates a simple, summarized report for a publicly traded company and explains how these five key financial data points are interpreted for the purpose of setting the sell point. In the fourth section below, the lesson covers the importance of business ratios when comparing multiple members within a pool of investments. Finally, all of it is summed up with trending analysis. The last section covers additional information, specifically key performance indicators. No two industries are alike; thus, key performance indicators are industry standards, and it is explained how to discover the respective industry performance indicators.
In Phase Two of this program, all of these elements of financial analysis are covered in greater detail. The goal is to get the member to develop their investment pool of five to eight potential investments within the same industry. With this introduction, members will gain the needed confidence to not only find the data, but also how to organize and begin to interpret the information.
Financial Analysis – Gathering Data
Gathering information related to any publicly traded company is not difficult, but it is somewhat cumbersome. There are three key sources of information. The first, and required by law, is the Securities and Exchange Commission (SEC). The second and most often used resource is the company’s website. The third source is more of an indirect resource as it sources its information from both the SEC and the company’s website. But in addition, these third-party resources also use write-ups, articles, and industry affiliations as additional material. The most common third-party resource is a brokerage dashboard via your broker account. The following explains all three in more detail and how you go about gathering this information.
Securities and Exchange Commission
Under federal law, all publicly traded companies must report activity to the Securities and Exchange Commission. In general, three common reporting requirements pertain to stockholders. The other forms of reporting do have some bearing, but are generally ignored because they are more legal compliance than financial in nature. The top three submitted reports are denoted by their form number.
- Form 8-K – This particular report reflects any information that may affect the stock of the company. For example, if upper management stock options or management trades occur, it is reported in this report. Other examples of 8-K information include:
- Financial Information Only
- Presentations of Information That Include Financial Information
- Press Releases
- Major Incidents
- Upper Management Changes (Retirements, Departures, Deaths, etc.)
- Form 10-Q – The report is slightly different than the 8-K in that companies will often present their quarterly financial information with this report. The company may report financial information with the 8-K, but if they include additional information such as performance information or presentations, they must use Form 10-Q and not 8-K. 8-K is acceptable if it is only financial. The idea here is that the 10-Q is integrated with additional information, whereas with the 8-K, financial information is limited to the traditional financial statements.
- Form 10-K – This is the annual report required of all publicly traded entities. Often, many companies simply include every page of their traditional annual report to shareholders.
Notice how the three reports are simply increasing levels of information; 8-Ks are pertinent information; 10-Qs include financial and supporting data; 10-K is the annual report.
The SEC uses software to retrieve the information for the reader. If you want to find any company’s information, simply go to https://www.sec.gov/edgar/searchedgar/companysearch.html and type in the company’s name. The resulting feedback will include all reports as filed by that company, with the most recent on top. It is not abnormal to see daily reports when working with the top 2,000 companies in the world. Remember, if an upper manager exercises or buys/sells their stock options or shares, they must report this information to the SEC, which is commonly reported on Form 4. Don’t be overwhelmed by the volume; simply look for the three most important reports as explained above.
Company’s Website
A second source, and probably the best overall source, is the company’s actual presentation of financial information found on its website. If you go to any publicly traded company’s site, you’ll find a section labeled ‘Investors’, often in the footer of the home page. Within this section are various pertinent pieces of information. Most companies copy the same information presented to the SEC and post it to their website. In addition, many will include quarterly webcasts to institutional investors, press releases, and key performance metrics. Much of this information is not on the SEC’s website.
Furthermore, top companies also include copies of their compliance reports to other federal agencies, presentations to associations, and general information brochures such as marketing material or industry statistics. Smaller companies like small-caps do not have the in-depth information presentation in the investors’ section that is common with the DOW and Large-Cap companies.
Brokers
A third source, and often the easiest to utilize, is brokerage websites. Many already compile the existing information with historical information to provide their users with the desired information. In effect, they source the information from the SEC and the company’s reports and load the data into their spreadsheets for presentation to their clients.
There are drawbacks with this source, though. First off, many of these dashboards do not report the information based on industry standards, but are tied more to a universal presentation format. For example, with REITs, a common other source of revenue is the sale of existing properties to a third party. It is common for REITs to sell one or two of their properties per year from their portfolio. Some brokerage programs include this sale of property as ‘Other Income’; others may include it with their definition of ‘Revenue’. Thus, it is with caution that the value investor utilizes brokerage websites as the primary source of evaluating the respective investments within the pool of investments.
The author utilizes a company’s website for information when loading data into the intrinsic and financial analysis spreadsheets. Brokerage presentation of information is used merely to gain a snapshot of the current status of the respective stock’s market price and not as the primary source of underlying data used with the decision models of value investing.
What is interesting about broker data presentation is that it assists with quickly assessing the key financial pieces of information, which are covered next in this lesson.
Financial Analysis – Five Key Pieces of Financial Information
Don’t misunderstand this section title’s intention; all data is important in a decision model. However, certain data points can provide immense value when an investor needs affirmation of the company’s stable earnings. These five key pieces of data include: 1) Sales Revenue, 2) Gross Profit Margin, 3) Net Profit, 4) Earnings per Share, and 5) Operating Cash Flow per Share.
The following subsections explain the importance of each key piece of information and what the value investor is looking for tied to this information.
Sales
Value investors are only interested in the top 2,000 publicly traded companies. Why? ‘Stability’ of earnings is the key overall impetus for determining value. Smaller companies simply don’t have a proven history or adequate profit to confirm stable earnings. If they did, they would be in the top 2,000 companies. Stability of earnings starts with sales. Large-cap and DOW companies have sales in the billions of dollars per year. Walmart’s sales exceed $500 billion per year. Number 2,000 has a tad over $1 billion per year in sales. Any slight deviation in sales volume doesn’t change the trajectory of large companies to generate profits. It will take sales volume changes of two and three percent before a significant impact is felt on the stock price. For example, take a look at McDonald’s sales volume between 2019 and 2018.
*Sourced from Exhibit 99.1 of Form 8-K on 01/29/2020.
The $51.3 million increase in sales between the two years is negligible.
What happened in the 4th quarter does impact the perception of McDonald’s, but not what happened for the entire year of 2019. To impact an investor’s opinion of a top-tier company, the sales volume change would have to be in the tens of millions of dollars, probably in the 100’s of millions of dollars. Thus, it takes what many lower-tier enterprises generate in sales in a whole year just to move the thinking tied to the large behemoth organizations in the upper tier of publicly traded stock. Again, it is very difficult to change the trajectory of large companies. Their stability is impressive.
This is why a lower percentage of value change per share for market price for large companies can be lucrative to value investors. If McDonald’s stock price was 12 to 15% lower on 12/31/2019 than 12/31/2018, a value investor would be very interested because the price change isn’t due to sales. The sales are there. Therefore, consumer demand exists, which is what every investor requires for the companies they buy in the market. Some other driver changed the value of the stock. Sales is just one of the five critical pieces of information.
For the reader’s understanding, McDonald’s stock price increased from $178 per share on 12/31/2018 to $200 per share on 12/31/2019 due to a significant improvement in operating income. Thus, some other piece of critical information saw a significant positive change to drive the price per share higher.
Gross Profit Margin
Many accountants, the author included, believe the single most important data metric is the gross profit margin. Gross profit margin reflects the percentage of sales after direct costs of sales are deducted. Each industry is different in what is a reasonable and acceptable gross profit margin. Some examples include:
- Service-Based Industries – A 38 to 42% gross profit margin is normal.
- Real Estate Rental (REITs) – A 33 to 37% gross profit margin is reasonable.
- Railways – 44 to 45% gross profit margins are normal.
For McDonald’s, gross profit margins average more than 51% making this industry quite lucrative. As a reminder, the gross profit is used to offset corporate costs, marketing/selling, interest, and income taxes. Any remaining balance is profit.
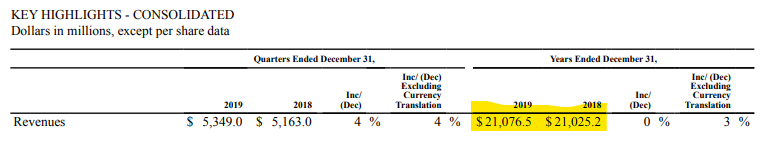
Look at the comparison for McDonald’s for the years ending 12/31/18 and 12/31/19.
.(in Millions of dollars) 2019 2018
Revenues $21,077 $21,025
Costs to Operate Franchisors/Franchisee Restaurants 9,961 10,239
Gross Profit $11,116 10,786
Gross Profit Margin 52.7% 51.3%
This 1.4% absolute increase in gross profit margin (2.8% improvement relative to 2018’s percentage) dramatically drove the per-share value higher by $22 from $178/Share on 12/31/18 to $200/Share on 12/31/19. Look at the value in whole dollars; this gross profit increase is $278 million. The company has 765 million shares outstanding; thus, each share improved by about 36 cents. In effect, not only is McDonald’s lucrative, but the fact that it set a higher standard of gross profit margin resets the expectation of shareholders related to future gross profit margins. Given the volume of sales, this additional 1.4% margin extrapolated out over several years adds a couple of dollars of value to the market price per share.
The point of this particular piece of financial data is that every industry has its own standard gross profit margin. Value investors research this key metric and keep an eye on the results from quarter to quarter to evaluate if a particular existing or potential investment is improving or is stagnant with operational costs as a percentage of sales. Only if the gross profit margin declines should a value investor consider reducing the intrinsic value of the respective investment and therefore create a greater spread between the buy-low and sell-high points.
For large organizations, the gross profit margin will hover in a certain range over many years; there’s an average for the respective industry. Understand this average and its formulation, and a value investor can more readily determine risk and opportunity for their respective investments. It is highly unlikely, actually rare, that any significant (more than 3%) change in the gross profit margin will occur from one year to the next with large organizations.
But let’s assume that it does. What would happen with the proposed share price for evaluation purposes? Let’s continue with McDonald’s.
Suppose the gross profit margin decreases 3% relative to its current 52.7% down to 51.12% ((52.7% * (1-.03)) in 2020 from 2019. The underlying cause is irrelevant for now. Assuming similar sales as 2019, the gross profit decreases from $11,116 million to $10,775 million, or $341 million, or 45 cents per share. Assuming all other factors are normal, then the market price per share for McDonald’s should drop about three to four dollars per share.
The lesson here is that it takes a significant change in a single financial piece of information to greatly affect the stock price per share for large companies. The law of large numbers states that the significant decrease in gross profit will not hold indefinitely. Thus, if the market overreacts, and it often does, it provides an opportunity for value investors.
Although the gross profit margin is considered the most important financial piece of information, it doesn’t mean the company will make a profit. Corporate operations, interest, and income taxes can exceed the gross profit and generate losses. Thus, the next financial point of interest is the net profit.
Net Profit
For many investors, this is the key financial metric. Without profits, shareholders don’t earn any value from the time period reported. What is interesting to note is that profits can be affected by many different circumstances. Often, companies report unusual or extraordinary financial events after normal operations as ‘Other Income or Expense’ for the company. A perfect example of this is the loss PG&E reported for 2018. During that year, a fire in California called the Camp Fire was started due to an electrical spark from a substation of PG&E. Altogether, PG&E estimated an extraordinary cost associated with that fire of $14.8 billion, causing the company to lose $10 billion before tax recapture tied to this loss. Think about this for a moment: PG&E’s normal revenue is almost $17 billion per year.
Thus, net profits are important, but a reader must understand their financial dynamic. Value investors look for patterns. Existing and potential investments will create a normal and reasonable expected annual profit as a percentage of revenue.
As with all large companies, the profitability will not deviate much from the standard from year to year unless the company is relatively new in the top 2,000 companies. Again, value investors only consider members of the top 2,000 that have proven over extended periods the ability to generate profits from one year to the next. A good standard to work with is companies with more than 20 consecutive years of profitability, during which they endured at least one economic recession during this time cycle.
Net profits are often tied to earnings per share, which is the next important financial metric.
Earnings Per Share
Earnings per share are simply the net earnings divided by the number of shares outstanding. Continuing with McDonald’s from above, in 2019, McDonald’s earned $6.025 billion. With 765 million shares outstanding, each share earned $7.88.
The key to earnings per share is how these earnings are used. Most large corporations use this money for three different functions. The first is to reinvest in the company. Some companies purchase additional fixed assets or buy smaller companies that will enhance the overall organization (vertical or horizontal integration). The second part is to reduce the overall debt of the company. The final piece is to pay dividends to shareholders. In some cases, the company will buy back stock from shareholders at current market rates. This is known as treasury stock.
Of course, with large-caps and DOW companies, investors are looking for dividends. This helps to establish the price-to-dividends ratio, which is one of the key business ratios used in valuations. The reality is straightforward: without earnings per share, dividends will cease to exist. Almost every single large corporation pays dividends to its shareholders. Think of it as an unwritten rule of business. The company has been around for many years, it’s profitable year after year, and dividends are a key sign of market presence. This is especially true if the company can consistently improve the dividend payout year after year. This is what drives stock prices higher.
Stable earnings lead to dividends, which in turn lead to higher market values for the respective stock.
Again, go back to what this lesson is about. Large corporations demonstrate their position in the market by paying continuously improving dividends year after year. How? Stable earnings are demonstrated by improving sales, good gross profit margins, positive earnings, and earnings per share for payouts of dividends. This is what investors seek. Failure to demonstrate positive key financial data points indicates possible issues or troubles with the company’s ability to maintain its market position.
There is one last key financial data metric. This is the operating cash flow per share.
Operating Cash Flow Per Share
One of the most difficult aspects of business is understanding cash flow. Most CPA’s take years before they reach that ‘Ah-Hah’ moment of fully understanding what it is and how cash flow works. In general, cash flow is divided into three major groups. Two of the groups (investing and financing) are easy to understand. It is the first and most important group that causes heartache with investors – cash flow from operations.
Cash flow from operations is commonly referred to as operating cash flow. At the micro business level, it can be extremely frustrating because the net profit is adjusted for various current assets and liability issues. When a customer doesn’t pay their invoice to the company, it reduces cash flow. If the company fails or delays payment of vendor bills, it improves cash flow. It can be quite perplexing for non-accounting types of investors. However, when companies move towards huge numbers, such as your top 2,000 companies, operating cash flow begins to mimic actual earnings per share adjusted for depreciation. Why? Because even a slight delay in payment of receivables or payables will have little bearing on the outcome of cash flow in comparison to net earnings. With small companies, even mid-caps, operating cash flow will almost always NOT mirror earnings, even when this value is adjusted for depreciation. This is a wonderful benefit of the law of large numbers.
For example, Union Pacific is the largest railroad in the United States. Revenue exceeds $20 billion per year. In 2019, Union Pacific’s net income reported was $5.9 billion. Add back depreciation, and the adjusted net income for depreciation equals $8.1 billion. If you review the cash flow from operations portion of the cash flows statement, the net cash flow from operations for Union Pacific in 2019 equals $8.6 billion due to a $566 million tax deferral (non-payment of taxes that was taken as a deduction to determine net earnings). Thus, cash flow from operations nearly mirrors adjusted net earnings for this company. This is almost always the case with large corporations.
Thus, when a value investor reviews those five key financial points, the investor should see similar values for net earnings adjusted for depreciation per share as cash flow from operations per share. Basically, any deviation of 6% or more on the other side of adjusted net earnings should be investigated for the underlying source. This is taught in Phase Two of this program. Please do not get too concerned or overwhelmed by this particular key financial point. A spreadsheet is included during Phase Two to assist you with calculating the final amounts. For now, this lesson teaches that operating cash flow per share will match earnings per share when the earnings per share are adjusted higher due to the depreciation deduction. The two final results should be very close dollar results.
Why is this so important? The key is cash flow per share. If operating cash flow per share is significantly less than adjusted earnings per share, it is a glaring WARNING of trouble. Something is amiss, and you must research this or avoid this stock in your portfolio of existing or potential investments. It is acceptable for cash flow per share to be higher than adjusted earnings per share, but never less. Without cash flow, the company can not pay dividends, and thus the market price per share of stock will tumble quickly.
This is explained, illustrated, and coached during Phase Two of this program. This will be a rare situation with large companies, but it is important for value investors to identify this detrimental financial warning sign.
The next section ties the five key financial data points together for the reader. It is here that you are introduced to creating a data matrix for decision-making.
Financial Analysis – Setting the Sell Point
The most commonly used term with stock investments is the ‘Price to Earnings’ ratio, or P/E. Basically, it reflects the price per share against the earnings per share and is presented as a flat number, such as 18:1 or 18. Typically, the P/E ratios in the stock market range from lows in the lower teens to as high as the upper 20s. Thus, a 13:1 ratio is appealing to buyers of stock, whereas a 27:1 ratio is a pretty high price to pay for a share of stock. Sellers want to dispose of their stock when the P/E begins to exceed 27 and 28:1 levels.
Novice investors believe the P/E ratio is universally applicable to all stocks. IT IS NOT! Each of the tiers of companies within the markets has different ranges of what is poor and excellent P/E ratios. The riskier the investment, the greater the shift towards lower ratios for both the buy and sell points. Thus, with penny stocks, opportunities to buy exist in single-digit amounts, and selling is common when the P/E gets into the lower teens. How so? Well, it is simple, penny stocks often don’t have earnings per share; thus, it is difficult to measure P/E. Without earnings, what is the mathematical result for the ratio? How do you divide a positive price by negative earnings?
When companies produce good earnings year after year and move into the top 2,000 companies, the P/E ratio begins to shift towards higher values for both the buy and sell points. The S&P 500 has average ratios exceeding 17:1 and frequently gets into the lower 30s. The overall average is in the low 20s.
Go back to the McDonald’s examples from above. In 2019, McDonald’s earnings per share were $7.88. The market price on 12/31/2019 was $200 per share. This means, McDonald’s P/E on that day was 25:1. The greater the quality of the company, the more likely the P/E is higher. Stability of earnings fetches better market prices for the stock.
This higher quality of market price per share is used as an advantage in value investing. It makes it easier to set the selling point of any investment. Value investors research the historical P/E ratios for the respective stock and can easily determine a reasonable recovery price to sell the stock and take their respective gains.
To illustrate this, a summarized report is created for a respective stock, and the sell point is determined.
Union Pacific is a Class 1 Railway and is considered a standard bearer for the railroad industry. The stock has traded from a high of $211 to a low of $118 during the last three years. Here is Union’s summarized report.
.(in millions of $) 12/31/2017 12/31/2018 12/31/2019
Revenue $21,240 $22,832 $21,708
Gross Profit Margin 56.7% 56.1% 59.0%
Profit B/F Taxes $7,632 $7,741 $7,747
Earnings Per Share $7.34 (Note A) $7.91 $8.38
Cash Flow Per Share $9.01 $11.52 $12.19
*Note A – In 2017, Union Pacific incurred a tax benefit of $4.8 billion, which increased the earnings per share by approximately $6 per share. The amount in this schedule is adjusted downward $6.02 per share due to the tax benefit. This is done in order to compare all three years by similar financial standards, i.e., the only adjustment reflects the tax benefit in 2017.
This is the P/E ratio for Union Pacific over the three periods of 2017 to 2020:
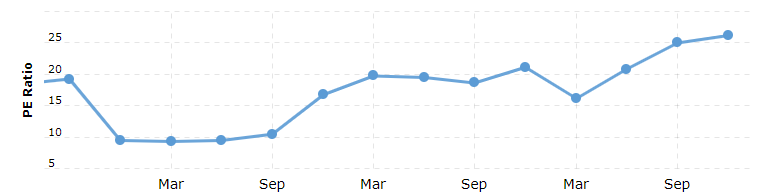 In the early part of 2017, the P/E ratio took a nose dive to 10:1 due to the decrease in the gross profit margin as reflected in the final quarterly report for 2017, into the first and second quarterly reports for 2018. The overall gross profit margin was down for 2018 (see the table above).
As the gross profit margin rises in 2019, the stock price increases, and therefore the P/E ratio improves into the 20s.
When looking at this graph, a P/E ratio of 90% of the peak is an acceptable price point for Union’s stock. Thus, with earnings per share in the $8.75 range (assuming reasonable growth), a 23.5:1 P/E ratio (90% of the peak of 26.17) allows for a $206 price per share as a reasonable expectation of a sell price for this stock. At the time of this writing, early December 2020, this is Union’s current market price for stock over the last 30 days.
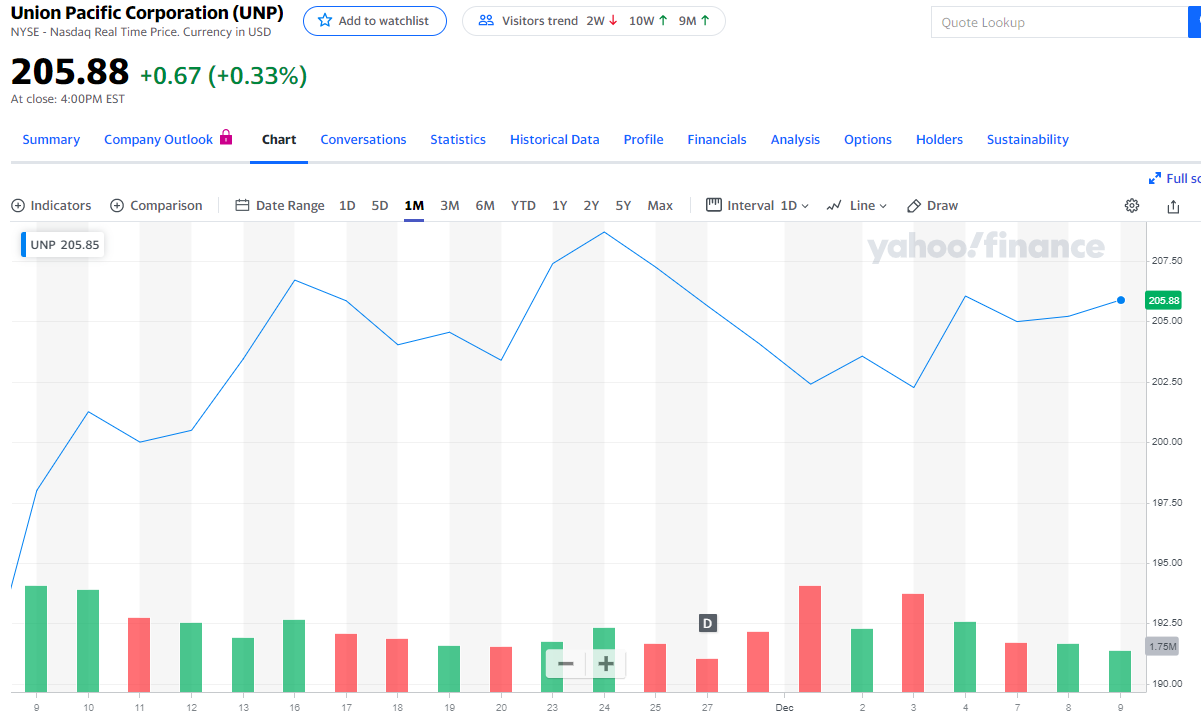 At the close of business on December 9, 2020, the market price per share was near $206 per share. Thus, holders of this stock would consider disposal to maximize gains. Currently, within the Railways Pool of funds in the Investment Fund for this site’s value investing club, the recovery price to sell the existing holdings is set at $215 per share. Some other incremental criteria warranted a higher market price to dispose of this stock within the Railways Pool.
The above-mentioned presentation is a shortened version of the actual methodical process value investors work through to ascertain the recovery price to sell stock with the respective members of the pool. Other factors may either increase or lower the final sale price, but in general, the above represents what is taught in Phase Two of this value investing program.
Setting the selling point not only includes the most likely best price in the market, but it also includes the period of recovery. Those stocks with longer recovery periods are evaluated differently from stocks with more frequent highs and lows in stock price. Remember, return on investment is tied to two significant contributing algorithm variables – dollars and time. This is covered in greater detail and illustrated in Phase Two of this program.
The above reflects just one investment opportunity within a pool of similar investments. The pooling concept allows the value investor to better understand the overall industry dynamics tied to the potential investments within this pool. Given this, there must be a tool to compare similar potential investments to best set buy and sell points for the respective investments. The answer is ‘YES’ and it is known as business ratios.
Value Investing – Business Ratios
One of the more difficult aspects of investing is comparing one company to another. It is nearly impossible when dealing with an investment in one industry when compare it to another investment in another industry. The same applies to different tiers of market capitalization for stocks. The only tools that allow for the best comparison among stocks are business ratios. And this is important, business ratios are only applicable to comparisons within the same industry. Go back to the section above, specifically to the important financial data point of gross profit margin. You cannot compare a real estate sector investment against a transportation sector investment. Their gross profit margins are vastly different. The same is true of their tax rates. REITs are generally tax-free, and the transportation sector is taxed at normal corporate rates. You cannot legitimately compare the two different sectors of our economy. The same is true with industries within the same sector. The gross profit margin is different for trucking than for railways or ocean shipping.
However, within the same industry, an investor can indeed compare companies. The tool that allows this is business ratios.
There are about 40+ business ratios; of these, 21 are core ratios used most commonly among investors. The remaining ratios are unique or industry-specific and are customarily a variance or combination of the 21 core ratios.
Lesson 12 in this series introduces business ratios. For now, the reader simply needs to understand that ratios are used to compare potential investments within the same pool of potential and similar investments. The idea is to rank the investments and set their respective buy and sell points. Once the financial analysis is completed for each potential investment, they are compared with other similar investments for ranking and evaluation. A standard bearer is revealed among the pool of similar investments. With the standard bearer in mind, the value investor can adjust buy and sell points for the remaining potential investments based on whether that company is improving towards the standard bearer or having difficulty keeping up with the industry standard overall. A comparison table is used to evaluate all the potential investments within that pool.
As stated in the opening paragraph of this lesson, large corporations rarely tend in any specific direction financially, other than a slow, continuous improvement. Business ratios assist with validating this via trending analysis. Other supporting information augments the trends, and this is what financial analysis is about – discovering the trend for the respective investment.
Join the Value Investment Club This site's Value Investment Club (Membership Required) utilizes a Value Investment Fund model with an annualized 25.9% return over a SIX-YEAR history. It has grown from a starting basis of $100,000 and is now $399,246 before taxes of $88,537. This is a 21% annualized return after taxes. Membership provides instantaneous access to time-sensitive information. Membership provides: Value investing, in its simplest terms, means buying securities at a low price and selling them at a higher market value. Value investing is defined as a systematic process of purchasing high-quality stocks at an undervalued market price, quantified by intrinsic value and justified through financial analysis, then selling the stock promptly upon market price recovery. Membership gives the reader full access to all information on this website. Act on Knowledge.
Value Investing – Putting it Altogether
The goal of financial analysis is to establish a high level of confidence that a particular company will perform with highly predictable financial results even during a recession. This is beneficial to investors in that they can more easily and confidently predict reasonable price variances between highs and lows for the respective investment.
There are several steps involved. The first and most important with acquiring a high-level, predictable price range is the exclusivity of stocks. Only high-quality large corporations are selected. This is because their variances over time are at best slight deviations from their historical trend. This is due to the law of large numbers; as a company gains in position with market capitalization, it gets more and more difficult to modify its financial elements. Sales, cost of sales, product lines, operational costs, and other business elements tend in the same direction. Think of McDonald’s; they rarely introduce a new product to their menu; they will have some seasonal items. But every product they sell is tested and accepted by focus groups prior to marketing and actual offering on the menu at their restaurants. Thus, McDonald’s sales are consistent and predictable. The same goes for their costs of food, labor, and operational costs at the restaurant level. At the corporate level, budgets are used to prevent overspending and maintain compliance with the upper management’s goals for certain financial targets.
This is the same across the board with all the top 2,000 companies. Deviation from the trend is unusual and rare. This makes financial analysis easier. Coupled with utilizing business ratios, and of course, one more pertinent piece of information augments analysis – key performance indicators.
Many companies provide production schedules, supplementary information tables, charts, and pricing structures with the quarterly financial statements. The additional information validates and provides proof that the company is on target to meet its respective goals for the year. In Lesson 11, key performance indicators are explained in more detail, and how and why value investors resort to this information to maintain a high level of confidence that their decision model (buy and sell points) is legitimate, and the only principle remaining is patience for the market to reach the respective buy and sell points. Act on Knowledge.