
Pools of Investments (Lesson 14)

Being a Navy SEAL and sniper taught me all about risk management. Take away all the risk variables under your control and reduce them to an acceptable level. The same fundamentals apply in business. Brandon Webb
Value investors utilize pools of investments, similar companies, all belonging to the same industry in order to reduce risk, create accurate buy/sell models, and manage their portfolio of investments in their investment fund. All potential investments in a pool must have similar attributes, including market capitalization, comparable operations, indistinguishable balance sheet relationships, and reporting formats. As explained in Lesson 11, all the members of the pool should have similar key performance indicators.
It is impossible to single-handedly manage hundreds of potential investments and design/build a separate buy/sell model for each company. To simply and efficiently create an investment portfolio, value investors create a group of five to eight very similar companies in the same industry. This is referred to as a ‘Pool’. Since this pool is dedicated to a particular industry, the investor can appreciate the research and due diligence required to understand the industry’s terminology, operational standards, and performance outcomes. It is the most efficient use of time.
Most value investors can only manage one or two pools of similar companies. However, one or two pools are insufficient to maximize a value investment portfolio. Thus, it is best to turn to a club where several pools are available to the investor. In effect, all club members share the knowledge of their respective pools with other club members, and this diversifies the portfolio for all members. When an opportunity arises, all members are alerted, and the club is rewarded as all members benefit from participation.
This lesson explains the benefits of using pools of similar potential investments as a value investor. Pools reduce risk exposure due to the comprehensive understanding of the key performance indicators and industry standards learned from research work and review of multiple similar reports. Secondly, with this knowledge, value investors can create highly accurate intrinsic and market price models to set the buy/sell points for investment with each member of the pool. Another advantage pools of investments create is the ability to efficiently utilize time to update the models. This, in turn, allows the investor to focus on properly carrying out the systematic buying and selling of stock to generate excellent returns. The following three sections cover these three benefits of pooling similar investments.
Pools of Investments Reduce Risk With Value Investing
A comprehensive understanding of an industry is one of the top three tools for managing risk, as explained in Lesson 6. The other two include purchasing only high-quality, top 2000 companies and purchasing stock of companies with deep financial pockets to withstand economic recessions and, if needed, depressions.
A comprehensive understanding of an industry begins with understanding how each industry has its own set of revenue streams and corresponding performance standards for that class of income. In-depth knowledge of the production metric reinforces financial outcomes. During interim financial reporting cycles, many value investors delve into the production reports to ascertain actual performance, as the financial results will follow performance.
The key to risk reduction is using highly restrictive attributes of the respective members. This is essential with comparing performance among the respective members of the pool. When starting the creation of a pool, select an industry with as many participants as possible. For example, suppose you decide to create a pool whereby the members must be in the utilities business. Utilities are interesting because it is an economic sector and not an industry. Utilities include:
- Electricity
- Water
- Sewage
- Power (oil, coal, natural gas & propane)
- Debris and Waste Removal
- Heat (oil, coal, natural gas & propane)
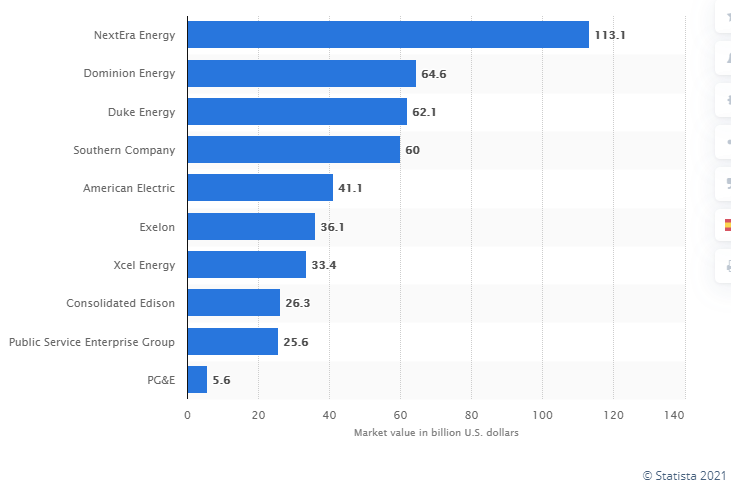
Notice the wide diversification within the utilities sector. The performance standards of the electrical energy segment are quite different than those addressing waste removal. The respective areas of this sector are industry-level groups. But even within that group, there are different revenue streams, and the value investor needs to have a pool of investments as similar as possible. For example, within the electricity industry, there are 100s of producers. Many are owned by municipalities or authorities. In all, there are about 168 investor-owned (publicly traded) electric utility companies. Of these, approximately ten exceed $5 billion in market capitalization value. They are listed below:
 Sourced from Statistica.com; thank you.
It would initially appear that all ten utility companies could be included in a pool of similar investments. The reality is quite different. Each potential member of this electric utility pool must have similar attributes in order to effectively reduce risk. The problem is that none of the ten are purely electrical generators of power.
The top three are vastly different. Here are their respective summary write-ups:
NextEra Energy – NextEra owns Florida Power and Light (FPL), the largest electric energy company in the United States. Altogether, NextEra has three revenue streams: the first is FPL; the second is NextEra Energy Resources, a clean energy generating resource company that operates solar, wind, and nuclear facilities; the third is Gulf Power, a traditional electric power company located in the panhandle of Florida.
Dominion Energy – Dominion Energy has two revenue streams from two different utility sources. Its primary source of revenue is the traditional electric power generation. The second source is natural gas storage, along with a pipeline system to move the gas. Take note, it doesn’t extract natural gas; it primarily transports natural gas. To complicate this a tad more, Dominion’s electrical arm also incrementally has revenues from its electrical transmission lines. In effect, it charges other utilities to use its transmission lines. Thus, Dominion is not a pure electrical generator or seller to residential users. Their revenue sources are complex, increasing the difficulty of comparing them to other electric utility generators.
Duke Energy – Duke Energy is also a conglomerate in the utility sector. Duke has two distinct revenue streams. One involves traditional electric utility generation, distribution, and sale to consumers; the other is a gas utility and infrastructure. Although somewhat similar to Dominion, their respective ratio mix is dissimilar.
The primary key to a successful pool is to find similar companies in the same industry with similar attributes. Similarities in descending order include:
- Market Capitalization Above a Preset Minimum;
- Comparable Business Models via Revenue Streams;
- More Than 90% of Revenue Must Be North American-Based;
- Key Performance Indicators Are Similar;
- Indistinguishable Balance Sheet Relationships.
When the respective potential investments in the pool are so similar that the companies are almost identical, it makes it easier to calculate intrinsic value and perform analytics to set the respective buy/sell points for each company within the pool. The following subsections clarify each of the primary attributes required for a pool of similar investments.
Minimum Market Capitalization
Market capitalization is defined as the market value of the company. It is merely the number of shares outstanding at the current market price. Thus, for Consolidated Edison, it has 342.115 million shares outstanding. The current market price (01/19/2021) is $69.50. Therefore, market capitalization equals $23.77 billion. Remember, this market capitalization value fluctuates daily.
In general, the minimum market capitalization for any member of any pool within the potential investment portfolio is $200 million. This mimics the lower 20 percentile bracket of the Russell 2000 and is slightly less than the lower 10% of the S&P Composite 1500. Any lower market capitalization and the risk factor associated with the going concern principle comes into play with value investing models. Better value investors are able to create a pool of similar investments with market capitalizations that exceed $1 billion for each member of the pool. The stronger the market capitalization for the pool, the less risk associated with not only the going concern issue but also the ability of the respective member to withstand difficult market recessions/depressions with share price. The idea is to have a potential investment that can weather market turmoil or a corporate-level embarrassment.
A good example of this is PG&E from the list above. Back in 2105 and 2018, the Butte and Camp Fires, respectively, in California caused extensive damage, and PG&E took responsibility. In total, PG&E agreed to pay out $25.5 billion to settle claims from the two fires. The company completed its Chapter 11 bankruptcy filing back in the summer of 2020. Currently, the stock is trading at or around $12.00 per share. It has 530 million shares outstanding. Thus, the total market capitalization for PG&E equals $6.36 billion. It currently has about $85 billion in assets on its balance sheet. The book value per share is around $9.50. At the end of 2017, the company had $19.2 billion in shareholders’ equity with a book value of $37.33 per share. On December 31, 2017, the company’s share price was $42.43 with 515 million shares outstanding for a total market capitalization of $22 billion.
Thus, the company was able to endure the high cost associated with the two large fires caused by faulty equipment. To pay the settlement, the company used its strong shareholder equity position and net earnings from three of its fiscal years. It will take several more years for PG&E to fully recover and begin the process of regaining its former market capitalization position.
This minimum market capitalization footing ties directly to the first principle of value investing – risk reduction. To augment this risk aversion attribute, another attribute is required: comparable business models.
Comparable Business Models
The second most important attribute of the potential investment pool of similar companies is that they all have comparable business models. It is often assumed that a member of a particular industry solely performs that respective service or sells that industry’s product. This is more often not the case than normal. Compare the respective revenue streams for six of the above electrical power companies. The information is sourced from their respective 2019 annual reports.
Name of Company Electrical Power Natural Gas Sales Gas Distribution Other Total
Dominion Power $10,202 Million $2,413 Million $2,475 Million $1,482 Million $16,572 Million
Duke Energy $22,615 Million $1,759 Million $705 Million $25,079 Million
Southern Company $16,872 Million $3,792 Million $755 Million $21,419 Million
American Electric $9,246 Million $4,319 Million $1,997 Million $15,561 Million
Exelon $30,315 Million $3,636 Million $487 Million $34,438 Million
Xcel Energy $9,575 Million $1,868 Million $86 Million $11,529 Million
It is difficult to determine the respective relationships between the various revenue streams for each company. Their respective ratios of electric power to natural gas are significantly different. With Dominion, approximately 30% of its revenue is tied to natural gas. Whereas for Exelon, natural gas is less than 11% of its revenue stream. How do you compare companies with such differences? In order to reduce risk, the respective members must be comparable with their business models. This allows the value investor to better evaluate intrinsic value and opportunities. Furthermore, comparable business models ease financial analysis, making it incredibly easy to determine market recovery prices for the sell point in the buy/sell model.
Don’t misunderstand, you can utilize the above six companies in a similar pool; it just makes the work of analysis extremely difficult. The research work is more intense, and often, one has to make some inferences to solve equations. The more comparable the respective business models within the pool, the easier it is to assess the respective buy and sell points for the respective members of the pool.
North American-Based Operation
Every publicly traded company operates under a charter and a set of regulations promulgated by its respective government. All North American operations must comply not only with their respective highest tier government regulation but also with the U.S. Code and its corresponding regulations. The current US-Mexico-Canada trade agreement and the former NAFTA trade agreement created a set of regulations that all three countries agreed were in the best interest of all parties. Thus, any North American-based operation generally complies with U.S. law. Furthermore, compliance documentation requirements and access to that information reduce risk for all investors.
If a company is outside of North American compliance requirements, it requires a lot more research and understanding of foreign regulations in order to determine financial results. This is simply too extreme for a traditional investment portfolio. Thus, in order to minimize time investment and create uniformity, only consider North American-based operations when selecting potential investments for your pool.
Similar Key Performance Indicators
Lesson 11 goes into more detail about key performance indicators. To effectively reduce risk and improve outcomes for intrinsic and market recovery values, the key performance indicators must be similar among the potential investments in the pool. Key performance indicators are customarily industry production standards that assist the value investor with identifying similar companies to include in the pool of investments.
When the key performance indicators are similar, it is easier to gather the data, compile the information, and then present the outcomes in an organized format. This allows for easy comparisons within the group of companies.
For example, with the electrical companies above, a key performance indicator would be the cost per kilowatt of energy produced. Another indicator could be a mix of energy production, i.e., an energy matrix. How much is produced by the lower-cost methods against the more expensive fossil-fuel-driven production plants? Other performance indicators include the number of employees against revenue generated, or maybe the ratio of the cost to revenue per stream against the revenue mix. As explained in Lesson 11, often the key performance indicators are identified in the annual reports, as there is often a lot of information or write-up about the respective performance standard (typically found in the ‘Notes’ section of the financial statement).
Indistinguishable Balance Sheet Relationships
A fifth attribute that helps to reduce overall risk with the pool of similar investments is ensuring that all the members of the pool have indistinguishable balance sheet relationships.
Balance sheet relationships refer to the respective ratio relationships of:
- Current/Fixed/Other Assets Percentages to Total Assets
- Assets to Total Liabilities
- Debt to Equity Ratio
- Fixed Assets/Debt Ratio
- Common Shareholder’s Equity Percentage
These relationships must be indistinguishable among the respective members. Any differential greater than 20% of the average presents either an advantageous or detrimental position for that company over the other members of the pool. The easiest method to compile the information is to create a table of comparatives. With some industries, the analyst will have to modify the respective relationship ratios to match that industry’s typical balance sheet model. For example, insurance companies often have strong investment portfolios as a function of current assets or other assets. These investment portfolios act as the reserve for claims tied to catastrophic events. Thus, the ratio relationship should be similar among all members of an insurance pool. If not, this can impact other income results or require deeper available lines of credit to meet sudden claim demands.
Other industries may have an inclination towards the fixed assets to long-term debt ratio. The longer-lived asset-driven industries such as REITs, airlines, railways, shipping, and entertainment finance these respective assets with long-term debt. If the ratios do not mirror each other, e.g., one is leveraged significantly more than others, it can moderately to greatly impact critical line items on other financial statements. Think of increased interest payments for debt over the average. Or, just as importantly, the impact of principal payments on cash flows in the future.
Thus, the member’s balance sheets must be similar to the relationship ratios. Extreme deviations from the average will distort results with other financial statements, causing the reader to misunderstand the outcomes or miscalculate the respective buy/sell points for that company.
The primary purpose of a pool of similar investments from the same industry is significant risk reduction. Having similar companies with market capitalization, business models, key performance indicators, and indistinguishable balance sheet relationships, all based in North America, allows the value investor to create comparable models that distinctly improve analytical results. With this information, value investors can then accurately determine intrinsic value and the associated market recovery values.
Pools of Investments Increase Accuracy for Both Intrinsic and Market Recovery Values
There are two financial points required for value investing. The first is the buy point, or what is customarily referred to as the intrinsic value measurement. This particular financial value is a reasonable dollar value for the stock. In effect, it is the dollar amount that reflects what the right to ownership of the stock is truly worth. There are multiple tools to measure this value, and each industry uses different methods or a combination of measurement tools to determine intrinsic value. The goal is to determine the buy point for the value investor.
The second financial point is the market price. The idea here is that the market often drives the price up due to multiple reasons. Everything from economic-wide enthusiasm to company-specific results. In many cases, the market price is pushed higher because the industry is viewed favorably; the economy is strong, and the company reports good earnings at the end of the quarter. Suddenly, this triple effect pushes the price of the stock past its prior high. Value investors use several financial measurement tools supported by historical information and documented with business ratios to determine the market price. With this information, a market recovery value is determined, and now it is just a matter of maintaining patience to deliver good results.
Pools allow the value investor to determine the industry element of the respective formulas when setting both intrinsic and market recovery price points. In Lesson 3, it was explained that industry-wide issues have the second greatest effect on stock prices for industry members. By having a pool of multiple similar potential investments, calculating the respective buy and sell points for the members of this pool is efficient. More importantly, industry-wide standards and application of key performance indicators for the respective companies assist in effectively determining the buy and sell points for each company. Pools increase accuracy by setting the buy/sell triggers for each company within that pool.
Join the Value Investment Club
This site's Value Investment Club (Membership Required) utilizes a Value Investment Fund model with an annualized 23.3% return over a SIX and THREE QUARTER-YEAR history. It has grown from a starting basis of $100,000 and is now $411,989 before taxes of $91,166. This is a 19% annualized return after taxes.
Membership provides instantaneous access to time-sensitive information.

Membership provides:
- Email Alerts for any pending transactions or actual activity for this site's Value Investment Fund; members may want to mimic the transaction activity for their personal investment fund.
- Monthly Newsletter regarding the activity within the Value Investment Fund;
- Quarterly Spreadsheets for each active pool of investments with this facilitator's calculated intrinsic value, buy and sell points;
- Weekly Article regarding one of the 60-plus potential investments outlining the respective business dynamics, issues, standards, and calculated buy/sell matrices;
- Watch Notices for possible opportunities along with suggested buy and stop loss points.
Value investing, in its simplest terms, means buying securities at a low price and selling them at a higher market value. Value investing is defined as a systematic process of purchasing high-quality stocks at an undervalued market price, quantified by intrinsic value and justified through financial analysis, then selling the stock promptly upon market price recovery. Membership gives the reader full access to all information on this website. Act on Knowledge.
Pools Assist With Managing the Investment Portfolio
One of the advantages of having pools of similar investments is the improved manageability of an investment fund. By restricting the investment fund to a set few pools, the portfolio manager only needs to review industry-wide issues and standards to stay abreast of interpreting key performance indicators and corresponding financial results from the respective members in that pool.
Instead of a vast array of potential investments and lots of spreadsheets, an investment portfolio of a few pools can be easily managed and updated regularly. For most pools, updating performance indicators and standards is an annual step. Reviewing financial results is a quarterly update to a comparative spreadsheet for that pool.
The next lesson explains how the investment fund works and why developing pools enhances overall returns for a portfolio. Act on Knowledge.