
Value Investment Fund CRUSHES the Dow Jones Industrial Average by 353%!
On October 22, 2019, the Dow Jones Industrial Average was 26,823 (market opening). Today, October 18, 2020, the Dow Jones Industrial Average is 28,607. The DOW improved 6.65% in the course of one year (technically 361 days).
On October 22, 2019, The Value Investment Fund started with $10,000 in a based railroad fund. Today, the fund has a cash balance of $12,351.96 with no receivables or stock position. This means the fund had a return of $2,351.96 or a 23.52% return on the original basis of $10,000. This means the fund performed 353% (a factor of 3.53) greater than the Dow Jones Industrial Average in the same period.
How did this fund outperform the market? Two words explain the result – Value Investing.
Value investing is a style of investing whereby the investor uses business ratios to evaluate and set buy-sell points for each of the respective stocks within a pool of stocks. The pool consists of similar companies within an industry. Each company within this pool has a buy/sell point, and with this knowledge, the value investor simply waits for a trigger, a buy/sell point to occur, and automatically acts on the preset action. The results are undeniable: value investing generates significantly greater returns over the long run than the market does as a whole. It is simply a model that reduces risk and maximizes return on that investment pool.
This article will walk the reader through how this happened over the last year and will point to the respective articles I wrote and the actions taken to get the results. You will see how the pool of money increases with each economic transaction throughout the first year of this fund. The first step is to identify the fund and the pool of companies in this fund.
Value Investment Fund – The Railway Industry
When deciding on a fund group, the initial thinking was to work with highly stable industries that have an extremely low risk of failure or market value decrease tied to their underlying assets. The railway industry fits this perfectly. If you look at their balance sheets, they have extremely high fixed asset positions related to their total assets. In general, all of them exceed 80% of their balance sheet values tied to fixed assets. It makes perfect sense, railroads own land, rails, bridges, and long-term rights to travel through major cities.
The second aspect of my desire to create a group was uniformity. There are seven major railways located in North America. One is completely owned by Berkshire Hathaway, which tells you all you need to know. Anyway, the remaining six are all publicly traded, and over 95% of their respective revenue is tied directly to rail operations. Thus, it is easy and fair to compare them against each other.
The third and final criterion was to find a pool of similar companies, whereby all the members of that pool had similar financial results. It turns out that all six of the railways have the same financial characteristics:
- All generate a profit, the lowest net profit within the group is 22.8% (before Oct 2019),
- All have positive operational cash flow and good free cash flow,
- All issue dividends to their shareholders,
- All have gross profit margins > 34.5% with the average over 37%,
- All have low administrative overhead, generating high operational profit margins,
- All have similar 10-year growth lines related to share price.
All of the above allowed me to create a pool of potential stocks that were similar, and all I had to do was exploit any deviations to earn a good return on the investment. That is one of the core tenets of value investing – buy low, sell high.
To understand this further, read my article written on Oct 16, 2019: Railroad Companies: A Solid and Steady Investment.
With this similar pool of companies, I can now set up a set of buy/sell trigger points to act on over the next year. In this case, from October 22, 2019, through today (October 18, 2020).
Setting Standards With Railway Companies
The primary business ratio to evaluate fixed asset-based operations is the price-to-book ratio. This is simply the market price per share versus book value per share as a single value.
Book value equals the entire stockholder’s equity divided by the number of shares. The equity comes from the current balance sheet, which for most of these investments is the 2nd quarter of 2019. Here are the results:
. Name Record Date Shareholder’s Equity # of Shares Book Value
Union Pacific 06/30/19 $18.17B 725 Million $25.06/Share
CSX Transportation 06/30/19 $12.28B 798 Million $15.39/Share
Norfolk Southern 06/30/19 $15.31B 263 Million $58.21/Share
Canadian National 06/30/19 $17.98B 725 Million $24.80/Share
Kansas City Southern 06/30/19 $4.83B 101 Million $47.82/Share
Soo Line (Canadian Pacific) 06/30/19 $7.16B 140 Million $51.14/Share
The market price changes daily, and of course, the book value changes quarterly once the financial results are reported. Since almost every railroad company makes a profit, the book value generally increases, assuming reasonable dividend payments. Thus, the price-to-book value changes daily, but in general, there is a pattern.
In my article: Railway Stock Investments – The Standard of Measurement to Buy and Sell Railway Stock, I go into detail about the price-to-book-value ratio for these stocks.
In addition, I cover profit margins and how to compile the data and set buy/sell trigger points for each of the potential investments. The key is to create these buy/sell points and simply wait for them to happen.
How did this happen? The next section illustrates each buy and sell action over the last 12 months.
Value Investment Fund – Ledger of Activity
During the 1st quarter of the fund’s life, I made three purchases and one sale. I made a gain of $232.74 on Canadian Pacific stock as I bought at $219.99 and sold for $240.47 over approximately 30 days. In addition, I earned some dividends during the quarter. Thus, on 12/31/2019, the portfolio consisted of the following:
- CSX Railroad 103.60774 Shares at $72.36 for a total of $7,497.06
- Norfolk Southern Railroad 13.52375 Shares @$194.13 2,625.37
- Cash 270.32
The fund balance was $10,392.74. For more details on this, please read my article: Railroad Fund Status 12/31/19.
In the 2nd quarter (January 2020 to March 31, 2020), it got interesting as the market took a huge dive during the last week of February due to COVID. However, I adhered to the buy/sell points and just before the market decreased, I was able to sell CSX and make a gain of $746 after all costs of trade. Thus, going into the COVID situation, the fund had a cash balance of $11,305 driven by the gain on Canadian Pacific and the gain on CSX. In addition, back in late January, the sell trigger for Norfolk Southern happened, and I sold the 13 shares with a gain of $288. Thus, three sales to date with a total gain of $1,267 and the difference in dividends received.
Just before the COVID situation, the market peaked, and of course, all the railroad stocks were at or near their highest lifetime value points. Then on the 24th, the market dived, and railroad stocks went with the market and nose-dived with changes of 8 to 12% decreases. This, of course, triggered buys on my part.
On March 31, 2020, I held 49.0606 shares of Norfolk Southern. In addition, I used my excess cash position to purchase Union Pacific once its price dipped to $156.79, which occurred on the 27th of February. Thus, on March 31st, I held stock only with no cash or dividends receivable. You can read about this in this Post: Purchased Union Pacific.
In the 3rd quarter of the fund’s life, I received dividends from Norfolk Southern. Also, the granddaddy of railroads, Union Pacific’s price recovered to the sell trigger point ($182.54) on 06/05/2020. Furthermore, I earned $8 in dividends from Union Pacific during the holding period. I wish that I had waited two more days and used the entire fund to buy Union Pacific, but my model is designed to eliminate guesswork and just be patient, and it will work. And yes, it sure has.
Two articles I wrote substantiate the Union Pacific activity:
On June 30th, I held Norfolk Southern stock only and to date have made four full transactions (buy and sell). Thus, on June 30, 2020, this was the fund’s position:
49.060606 Shares of Norfolk Southern Corporation – Closes at $175.82/Share FMV = $8,625.84 (Avg Buy Price/Share = $203.83 for Basis of $10,000.00)
Cash Position, including recent dividend payment from NSC = $1,555.16
Total Fund Balance = $10,181.00
FMV Gain as a % Since Inception: = 1.81%
Gain on the initial fund basis of $10,000 is $181.00.
Dow Jones Industrial Average on Oct 22 at opening: 26,828
Dow Jones Industrial Average on June 30th, 2020, at closing: 25,813
Market Change as a Percentage Decrease: -3.78%
The above is from my June 30th report.
The key to value investing is patience. I felt comfortable that Norfolk Southern would recover. Why? Because the business ratios not only indicated a rebound, but the underlying business fundamentals had not changed, with the company’s performance. All the key performance indicators are there, showing the company will recover. And sure enough, it happens slowly from May and hits its prior peak in September.
On 09/14/2020, Norfolk Southern’s price hit the sell point from my model, and the automatic sell kicked in, and the stock returned a whopping $750.63 as a gain after fees. This means that throughout five full buy/sells over one year, the fund earned $2,206 in gains and another $146 in dividends during this period.
Thus, on September 30, 2020, the fund was in a pure cash position with $12,352 balance.
Summary – What was Expected and Actual Results
Initially, I sought a 30% return on the investment. I stated in one of the earlier articles that, in effect, value investing can generate significantly greater returns contingent on traditional market swings that occur throughout a calendar year, and by maintaining patience, the investor would be rewarded.
In a typical year, the DOW will grow about 5.5%. In the recent past 30 years, it has averaged closer to 8%. Thus, a 30% return on an investment is significantly greater than the market’s average. Since the market only increased 6.7% during the past year, it did okay, but not up to par with its recent past. Of course, the COVID-19 epidemic took a lot of confidence out of the market.
This is a snapshot of the DOW Jones Industrial Average over the last five years.
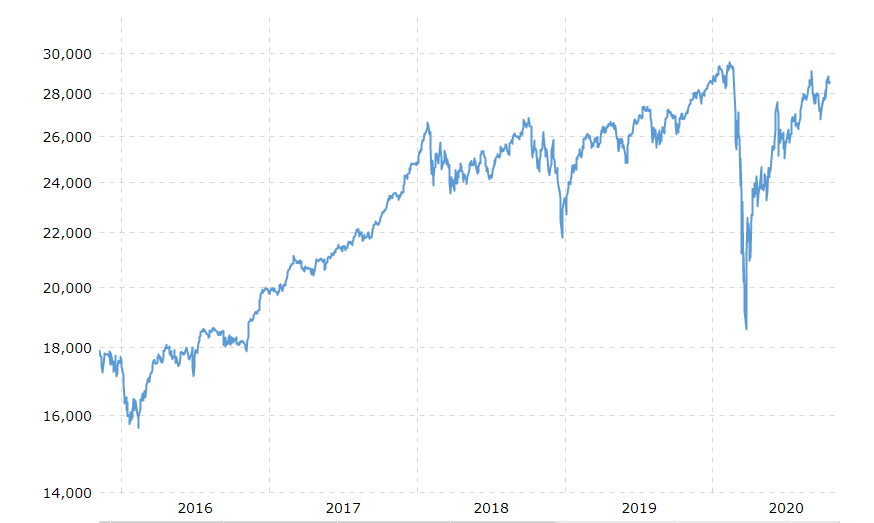 There are about 12 distinct downturns that happen within a short period (<2 weeks). The downturns are at least 3.5% of the market’s prior peak value. This is where opportunity exists to buy low. The really big dip in February/March 2020 would have been highly lucrative if one had known and was willing to wait for such a decline (about 25% of the entire value). But no one has this perceptible power.
Thus, once any of your target investments are triggered by such a decline, a value investor buys and simply waits for the investment to recover to its prior peak and then sells the stock.
The best aspect of railroad investments is that they have a very low risk of a super decline in value, i.e., where the investment decreases more than 60% of a prior peak. There is pushback as the price drops because the respective set of companies rarely absorb losses in any year. None of the six railroads lost money during the 2008 – 2012 recession period.
However, after evaluating each stock, I knew there would be periods of decline, and that was my opportunity to buy. Right now, all of the stocks are at or near their respective lifetime highs.
The final result did not live up to my expectations. Since the overall market didn’t perform as well as expected, my actual results were dampened, and thus the fund only generated a 23.5% return. Still, I took advantage of the value investing principles and way outperformed the market. Now I need to generate a list of lessons learned and develop additional tools to increase the overall return without increasing the risk factor. Act on Knowledge.