
Value Investment Fund – End of Year 2021 Report
“The bad news is that time flies. The good news is you’re the pilot.” – Michael Altshuler.
During 2021, the Value Investment Fund recorded an outstanding 41.08% return on its December 31, 2020, balance of $116,231. The Value Investment Fund ended 2021 with a balance of $168,430. The difference is composed of the following forms of earnings:
- Realized Gains, 6 transactions $46,801
- Less Unrealized Gains at 12/31/20 (11,892)
- Dividends Earned 2,451
- Sale of PUTs 2,861
- Unrealized Gains (See Below’s December End of Month Report) 11,978
$52,199
The effective annual return on the investment equals 41.08%. The target for a value investor is more than 30% per year. What helped boost this good return was the overall market gains during 2021. The DOW Jones Industrial Average increased 18.73% which is an outstanding year for the DOW. Over the last 20 years, the Dow has averaged an annual return of 11.3%. A similar pattern holds against the S&P 500. During 2021, the S&P 500 generated a return of 26.61% and over the last 10 years, it averaged 12.15%. Even with adjustments for the better-than-average returns across the board in the market, this site’s Value Investment Fund still beat the goal of at least 30% per year.
Value Investment Fund – End of December Report
. December 31, 2021 December 31, 2021 November 30, 2021
REIT Pool # of Shares Cost Basis Market Price* Fair Market Value* Fair Market Value*
– No Stock Holdings (All six REITs are at or near their all-time highs)
Railways Pool
– No Stock Holdings (All six railroads are at or near their all-time highs)
Insurance Pool
. – No Stock Holdings (All five insurance companies are at or near their all-time highs)
Military Contractors Pool
. – Huntington Ingalls Industries 112.9943 20,000 185.74 $20,987.56 $19,944.62
Banking Pool
. – Wells Fargo (Tranche #1) 292.0560 10,000 46.98 $13,720.79 $13,662.38
. – Wells Fargo (Tranche #2) 558.9715 20,000 46.98 26,260.48 26,148.69
. – Wells Fargo (Tranche #3) 234.3292 10,000 46.98 11,008.79 10,961.92
. Sub-Totals 40,000 50,990.06 50,772.99
Dividend Receivables -0- 217.07
Cash on Hand (Basis, Gains, Dividends, PUTS) 96,452.17 96,235.10
Totals (Starting Cost Basis = $100,000) $60,000 $168,429.79 $167,169.78
*Net of transaction fees of $1.00 per share; thus, the amount in the schedule equals the actual market price per share at closing, less $1.00 per share.
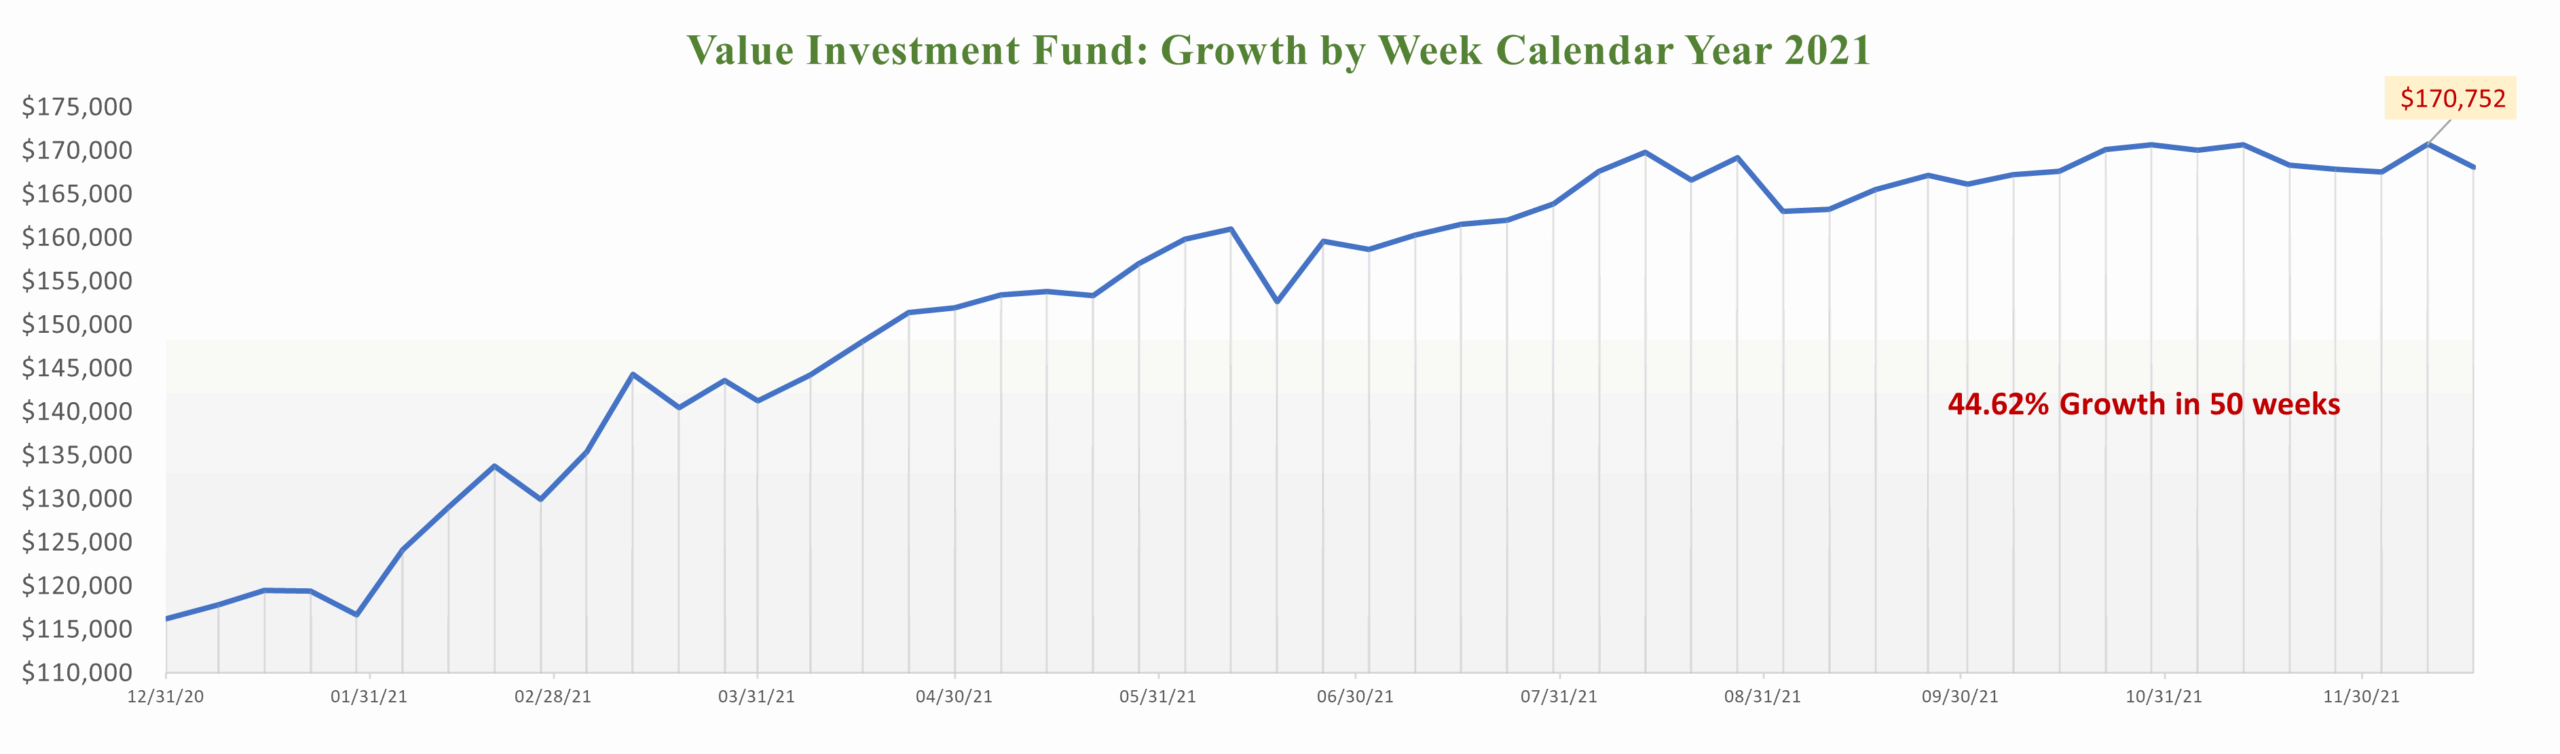
On 12/10/2021, the Fund’s end-of-week balance hit the highest point during 2021 at $170,752. At the time of this post’s generation, 01/17/22, the Fund’s balance is $182,329, reflecting the dramatic improvement tied to Wells Fargo; read Wells Fargo One Year Report for additional clarification.
Value Investment Fund – Risk Exposure Due to PUTs
PUTs are an options tool employed with value investing to leverage the annual earnings of a portfolio. The idea is to sell an options contract to own a particular investment at a super discount to intrinsic value. In effect, it is an ideal tool to earn money, and if the economy, industry, or company takes a deep dive with market value, an investor can own a security at a very low price. In general, value investors will only place at risk approximately 60% of a Fund’s beginning year cost basis (explained in more detail in Phase III of this site’s membership program). At year’s end 2021, the Value Investment Fund held the following option contracts:
Beginning Year Cost Basis – $104,339 (Beginning Balance of $116,231 less Unrealized Gains of $11,892)
Maximum Position in Option Contracts at 60% of Cost Basis – $62,603
- Union Pacific Railroad – purchased in Feb 2020 with a strike price of $155/share and an expiration date of January 21, 2023 $20,000
- Norfolk Southern Railroad – purchased in March 2021 with a strike price of $190/share and an expiration date of January 21, 2022 $20,000
Current market prices for the respective stocks on 12/31/2021:
- Union Pacific Railroad – $251.93
- Norfolk Southern Railroad – $297.71
Given the near-term expiration of Norfolk Southern Railroad in 21 days, the likelihood of exercising these options is remote in the next quarter. Going into 2022, the Fund’s cost basis is $156,452. The maximum exposure allowed related to PUTs is reset to $93,871.
Value Investment Fund – Reconciliation of Ending Balance 12/31/21 to the Value Investment Fund Balance 2 1/4 Year Chart
This site’s Value Investment Fund started on 10/21/2019 with an initial balance of $10,000. After two and a quarter years, the facilitator needed to restate the Fund’s activity such that a single annual rate of growth could be determined and there would only be one reported analysis. In effect, the original investment of $10,000 was restated as if it were $100,000, and each transaction that occurred from October 2019 through October 2021 was increased by a factor of 10. In addition, any realized gains, dividends, and sales of PUTs were taxed at 28% per the goal of this Fund to act as an independent legal entity.
During the five quarters (October 2019 through December 31, 2020), the Fund had the following breakout:
- Initial Fund Investment October 2019 $100,000
- Realized Gains/Dividends/Sale of PUTs 26,311
- Taxes Paid on Realized Earnings to Date (7,367)
- Unrealized Gains on 12/31/2020 11,892 (See Above 2021 Schedule)
Value Investment Fund Balance on 12/31/2020 $130,836
The Fund reported a return of 34.41% in 2020, reflecting a beginning balance on 01/01/2020 of $103,170 with a cost basis of $101,947 (unrealized gains of $1,124 existed on 12/31/2019). During 2020, the Fund realized $23,608 in gains/dividends/sale of PUTs, and unrealized gains of $11,892 for a total realized/unrealized return of $35,500. This $35,500 is divided by the Fund’s starting balance on 01/01/2020 of $103,170, and the result is 34.41%.
The starting Fund balance on 01/01/2021 was $130,836. During 2021, the Fund had the following breakout:
- Initial Fund Investment 01/01/2021 $130,836
- Realized Gains/Dividends/Sale of PUTs 53,661
- Taxes Paid on Realized Earnings to Date (15,025)
- Growth in Unrealized Gains on 12/31/2021 86 (See Above 2021 Schedule Less Beginning Balance of $11,892 Reflected in Total Fund Balance on 01/01/2021)
Value Investment Fund Balance on 12/31/2021 $169,558 (Starting Balance on 01/01/2022) - Conversion Equity Contribution to Balance to Monthly Report (1,128)
Value Investment Fund Balance on 12/31/2021 (See Report Above) $168,430
Total growth during 2021 includes the realized earnings plus the increase in unrealized amounts for a total of $53,747. This is divided by the beginning Fund balance of $130,836 to identify an annual return of 41.08%. This now reconciles with the two-and-a-quarter-year chart as displayed on the main pages and many articles on this website. The equity contribution amount of $1,128 reflects the conversion of two separate independent reporting tracks (calendar and fiscal years) used historically on this site to calculate the various returns. Now the Fund balance reflects the actual amount earned net of taxes through 12/31/2021. In effect, the $1,128 contribution allows the fund to convert from a fiscal reporting cycle to a traditional calendar year cycle. This now accurately depicts the Investment Fund’s growth since inception. Act on Knowledge.