
Intrinsic Value – Definition and Introduction

Intrinsic value’s definition has several different meanings when used in the business context. The word intrinsic refers to ‘innate’ or ‘inherent’. Whereas value refers to the exchange mindset between two or more parties. Thus, intrinsic value refers to the core understanding between parties of the worth of something. Bread is the perfect example. At its core concept, bread is a food we consume as a starch; we eat it due to its relatively inexpensive cost to fill our bellies. When you go to purchase bread at the grocery store, there is already a preconceived price range for bread. Different flavors, packaging, sizes, and types determine the final price within this predictable range. It is easy to spot prices that are too high or, for some reason, well below expectations.
Intrinsic value works the same way. When looking at the market price for a security, knowing the intrinsic value prevents overpaying for an investment. The key is determining this price range for the security. The primary rule for intrinsic value is straightforward; it is a RANGE and not an exact dollar value. Just as with the bakery section of the grocery store, bread is priced within a range. With value investing, the goal is to narrow this range to a set of values that are REASONABLE and OBJECTIVELY verified. Therefore, rule number two, intrinsic value must be reasonable and objectively determined. Finally, all users of intrinsic value must understand and appreciate that intrinsic value is not static. It changes every day, and for highly stable companies, it should predictably improve every day with a high level of confidence.
The following sections cover these three rules tied to intrinsic value. The first section explains how intrinsic value is a RANGE of values and never a definitive amount. The second section discusses the importance of arriving at this price range in an OBJECTIVE manner and that the price range is REASONABLE given various ratios and performance indicators for the particular company. The third section below covers how intrinsic value is FLUID in business; it changes regularly, and with highly respectable, stable operations, it is constantly improving.
Intrinsic Value – A Range of Monetary Outcomes
Determining intrinsic value is not an exact science. Intrinsic value is a range of values determined from many different variables collected, collated, and applied in several formulas to derive results. In many cases, these results are extreme in their respective outcomes. For value investors, the idea is to acquire as many different results as possible over at least five and ideally eight or more different standard formulas. From these results, a range is extrapolated. As is typical with many derived results, highs and lows are tossed due to their extreme nature. Those that remain set the boundaries of the possible outcome. The goal is to find common ground among the remaining outcomes. Narrowing this outcome to a common, acceptable monetary range determines intrinsic value.
An illustration is appropriate. In this case, a simple well well-documented company is used to determine intrinsic value – Coca-Cola.
Typically, the first step involved in determining intrinsic value is to collect pertinent data. For brevity, the following data were collected on Coca-Cola.
Data Point 2021 2020 2019 2018 4 Year Weighted Average*
Revenue $38.6B $33.0B $37.3B $31.9B $36.3B
Gross Profit $23.3B $19.6B $22.6B $20.1B $21.9B
GP Margin 60.3% 59.4% 60.6% 63.0% 60.4%
Net Profit $9.8B $7.8B $8.9B $6.4B $8.8B
# of Shares Trading 4.3B 4.3B 4.3B 4.3B 4.3B
Earnings/Share $2.28 $1.81 $2.09 $1.51 $2.06
Dividends/Share $1.67 $1.64 $1.59 $1.56 $1.64
Book Value/Share $5.31 $4.48 $4.43 $3.98 $4.84
Operating Cash Flow $12.6B $9.8B $10.5B $7.6B $11.1B
Free Cash Flow $11.3B $8.7B $8.4B $6.3B $9.7B
Growth Rate 3.7%
Discount Rate 7.75%
Average Market Price $56 $55 $52 $47
Dividend Yield 2.98% 2.98% 3.05% 3.32%
Price to Earnings Ratio 24.5 30.4 24.9 31.1
* Weighting is as follows: 2021 – 50%; 2020 – 25%; 2019 – 15%; 2018 – 10%.
Over time, Coke’s market price continues to increase, reflecting the constantly increasing earnings per share. This is a DOW Jones Industrial member and is a result of its highly stable revenues, margins and profit. Furthermore, it experiences a good growth rate for such a well-established company (they have been publicly traded for 103 years). Excellence is their standard. As such, the market price to earnings ratio will always be strong (>20:1 ratio). In effect, it is a great company to buy when the price suddenly dips more than 25% below the most recent peak price. However, recall, market price is NOT intrinsic value. Intrinsic value reflects a fair and reasonable dollar amount that mirrors a general agreement among parties as to the worth of a security. The difference between the two prices (market and intrinsic) is the speculative risk many investors take, believing the market price will continue to increase.
For any stock-based security, a fair and reasonable value is measured utilizing a discount rate. This is the rate an owner of this particular security desires for the risk they assume. For a high-quality company like this, a discount rate of 5% is very fair. Coca-Cola has very little risk, but risk still exists. It isn’t government grade risk (1 – 3%), nor is it at the high-quality bond risk rates of 3.5% to 5%. However, it is still a super high-quality stock investment risk, which typically starts at around 5%. Thus, as an investor with this type of high-quality stock, a five percent return on your investment is considered fair and acceptable.
Therefore, the very first intrinsic value formula commonly used is the dividend yield tied to the stock-based discount rate. In this case, the average dividend is $1.64, and with a discount rate of 5%, the stock is worth around $33 per share. Coke is highly stable, returns a dividend to the shareholder, and, at greater than 60%, has one of the strongest gross profit margins for any company. It is a super quality company to own. It would appear on the face of values that $33 per share for intrinsic value is low. Thus, more intrinsic value formulas are required.
Intrinsic value formulas are commonly grouped by financial data. Historically, a very well-respected formula advocated by Benjamin Graham and David Dodd (the Fathers of Value Investing) is a formula tied to earnings. Their popular formula is:
Value = Earnings times ((8.5 plus (2 times a reasonable growth rate))
With Coke, this would equal:
Earnings of $2.06/Share times ((8.5 + (2X3.7));
$2.06 X (8.5 + 7.4);
$2.06 X 15.9;
$32.75/Share
Take note how close this is to the dividend discounted result from above. However, a value investor should never rely on just two results. More are required.
A third and quite common approach is to use the discounted earnings formula. This formula is an income statement-based formula and assumes earnings are normal and not inclusive of unusual or infrequent events. However, Coke, just like every other company, did experience an unusual event starting in March of 2020. COVID affected all companies across the board. With Coke, it caused a decrease in sales in the amount of $4.3 billion; thus, net profit was most likely reduced by around $1.2B, which in turn reduced earnings per share that year by approximately 28 cents per share. In the overall scheme of things, this probably impacted the average earnings per share by about 6 cents (due to the weighting effect of the 4-year average). The question here is this: should a value investor use the historical recorded average of $2.06 per share or adjust this for the COVID situation?
Surprisingly, the answer is to NOT adjust the average. The key is the average. Since 2019’s value is only weighted 25%, the net impact is slightly higher than 6 cents in the overall result. This aggregated 3% difference (6 cents divided by $2.06) isn’t going to dramatically affect the result (with business, dramatic refers to a change of more than 5%) with the discounted earnings formula, or, for that matter, any long-term time-derived result (discounted formulas customarily utilize 20 plus years to derive a result). Discounted future values are grounded in the near future over the extended future. The first seven years typically are worth more than 30% of the end result.
In this case, using a discounted earnings tool, Coke’s intrinsic value is estimated at $36.03 over the next 30 years, assuming a discount rate of 7.75% and a growth rate of 3.7%.
A Side Note
The discount rate used with the discounted earnings formula here is different than the discount rate used in the dividend yield formula. In the dividend yield formula, the discount rate reflects a much-improved overall risk position because it is dividends and not earnings. Dividends are a direct payment to the shareholder, whereas earnings don’t guarantee all of it going into the shareholder’s pocket as dividends. Thus, the discount rate for earnings includes not only the portion tied to equity ownership (the 5% desired rate used with the dividend yield formula), but also the ‘no risk’ desired discount (usually around 2%), the size premium, and the specific risk (is there a market for Coke’s securities). Thus, the discount rate for the discounted earnings and cash flow formulas is always higher than the discount rate for the dividend yield.
Notice how this result is slightly higher than the first two results? Often, value investors adjust the variables in the formula around the earnings. The two variables are the growth rate and the discount rate. Let’s assume a more conservative approach and increase the discount rate to 8.25% and reduce the growth rate to 2.9%; again, the idea is to be more conservative with the outcome. Using these factors, the intrinsic value shrinks to $30.96 per share.
A more aggressive approach might be to reduce the discount rate to 7.25% and leave the growth rate as is, 3.7% (it is very difficult for fully mature companies, in this case, Coke has been in business for over 130 years, to have strong growth rates greater than 4% per year). Using this more liberal approach, the discounted earnings approach values the shares at around $38.25.
A user of this formula could extend the number of years with discounting future earnings and go to 40 years; this will add anywhere from $3 to $5 per share, depending on whether the value investor incorporates conservative or liberal values for the two variables.
Notice already, the RANGE that is beginning to develop. To this point, the following results exist:
- Dividend Yield with a Desired Discount Rate of 5% $33/Share
- Graham & Dodd Formula $33/Share
- Discounted Earnings (7.75%, 3.7% Growth, 30 Years) $36/Share
- Discounted Earnings (7.75%, 3.7% Growth, 40 Years) $41/Share
- Discounted Earnings Conservative Approach (8.25%, 2.9% Growth, 30 Years) $31/Share
- Discounted Earnings Conservative Approach (8.25%, 2.9% Growth, 40 Years) $34/Share
- Discounted Earnings Liberal Approach (7.25%, 3.7% Growth, 30 Years) $38/Share
- Discounted Earnings Liberal Approach (7.25%, 3.7% Growth, 40 Years) $45/Share
This pattern results in a RANGE of a low $31 per share (conservative approach, 30 years) to a high of $45 per share (liberal approach, 40 years). There are still more intrinsic value formulas an investor could use. Many investors like to resort to cash flow as a more reliable indicator than earnings. In general, there are two sets of cash flow values to use. The first is purely the operating cash flow. These are earnings adjusted for non-cash expenditures such as depreciation and amortization. Coke has a very strong amortization deduction each year related to the years of growth when they purchased many rights to own certain brands, formulas, distribution venues, etc., over the last 40 years.
From the schedule above, operating cash flows exceed earnings by approximately $2.3 billion per year, or around 53 cents per year per share. In effect, the discounted formula uses $2.59 per share as the substitution value over $2.06 of earnings average per year. This additional 53 cents per year increases the overall intrinsic value result by about $9 per share. With the more conservative approach, the additional 53 cents per year increases the result by around $8 per share.
The key question here is, which is better? Should a value investor use discounted earnings, or should an investor use discounted operating cash flows? The answer is highly dependent on the investor’s belief system related to how cash flow is utilized. Most investors believe that it is important for the cash to be used to reward shareholders with dividends, reduce the overall risk of the company (paying down debt), and invest cash for future growth or to maintain the current growth rate.
Think about this for a moment, if Coke doesn’t take their cash and invest some of this money as capital expenditures, the growth rate of Coke will drop over the next 10 years and it is possible, that without this reinvestment into new products, geographical expansion and developing expanded distribution systems, the company could begin to retrench as the competition will take advantage of this non-growth position. Since most of the values derived above are heavily reliant on a moderate to strong growth rate, a good portion of the operating cash must be used to maintain the company’s market share and overall position in this industry. In effect, Coke must reinvest some of this $2.4 billion per year to maintain its overall position. Reviewing the cash flows statement identifies that Coke reinvests around $1.5 billion per year.
The result is that most of the 53 cents per share from cash flow is reinvested to maintain the company’s overall market position. Thus, a value investor can use operating cash flow as the basis in the discounted formula, but the investor must adjust this for the required investment to maintain the company’s overall market position. This is known as ‘Free Cash Flow’ (Operating Cash Flow less Capital Reinvestment).
With Coke, once you adjust the cash flow for maintenance requirements, it effectively ends up just slightly more than purely earnings, around $2.24 per share, as the basis for the discounted formula. This adds about $3 more per share with the results and not $9 per share utilizing nothing but operating cash flow. Now the results are as follows:
- Dividend Yield with a Desired Discount Rate of 5% $33/Share
- Graham & Dodd Formula $33/Share
- Discounted Earnings (7.75%, 3.7% Growth, 30 Years) $36/Share
- Discounted Earnings (7.75%, 3.7% Growth, 40 Years) $41/Share
- Discounted Earnings Conservative Approach (8.25%, 2.9% Growth, 30 Years) $31/Share
- Discounted Earnings Conservative Approach (8.25%, 2.9% Growth, 40 Years) $34/Share
- Discounted Earnings Liberal Approach (7.25%, 3.7% Growth, 30 Years) $38/Share
- Discounted Earnings Liberal Approach (7.25%, 3.7% Growth, 40 Years) $45/Share
- Discounted Free Cash Flow (7.75%, 3.7% Growth, 30 Years) $39/Share
- Discounted Free Cash Flow Liberal Approach (7.25%, 3.7% Growth, 40 Years) $48/Share
Again, the overall range of values expands slightly to a high of $48 per share. The range is now from a low of $31 to a high of $48. Statistical analysis suggests tossing the extremes of $31 and $48, and now the range becomes a low of $33/share, Dividend Yield, to as much as $45/share, Discounted Earnings, Liberal Approach.
Most of the results are from $36/share to $41/share. A RANGE of values is now set. The next step is to narrow this RANGE to something REASONABLE and OBJECTIVE.
A Side Note
The more stable the company, the more reliable the discounted formula becomes. Mid-Cap companies require additional supplemental formulas to assess intrinsic value in addition to the discounted method. Use fair market valuations for fixed assets; incorporate business ratios; and utilize the company’s notes to the financials to identify critical key performance indicators. As the company moves through its life span and improves, the discount rate also improves (decreases). For Mid-Caps, discount rates of 14% or higher are necessary to account for the additional risks associated with these companies. For those that are improving within the Mid-Cap level of companies, the discount rate tends towards 14% from 19%; for those companies unable to improve or demonstrate sound financial results year after year, the discount rate must increase to compensate for this additional risk. Value Investors SHOULD NEVER consider Small-Caps, Penny stocks, or even Over-The-Counter investments. For those types of companies, additional tools are required to determine intrinsic value, and the associated risk of deriving a reliable result is magnified dramatically. This is why value investors should only consider the top 2,000 companies, and within this pool of potential investments, only those that demonstrate continuous growth and performance during recessions or unusual events.
Intrinsic Value – A Reasonable and Objective Outcome
Is an intrinsic value of $36 to $41 reasonable and objective? How can you tell? Well, there are several tools available to value investors to confirm or independently verify that this is a good range of values. The most commonly used tool is the price-to-earnings ratio.
Price to Earnings
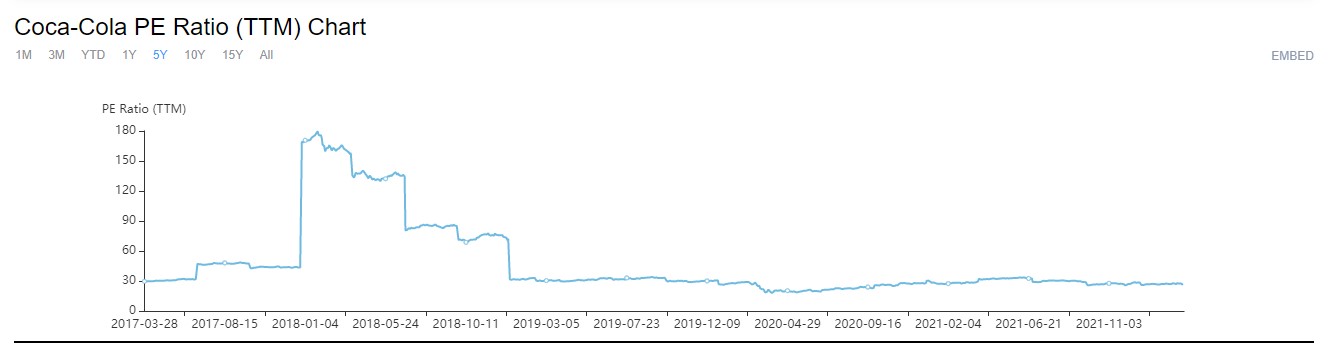
If you look at the history of Coke, the price-to-earnings ratio, i.e., the market price against the earnings, hovers in the 20s. The market price to earnings ratio rarely dips below 20:1. This chart illustrates Coke’s PE ratio over the last five years. The sudden high P/E ratio in 2018 is a direct reflection of Coca-Cola taking advantage of the new tax law in December 2017 and paying a dramatic amount in taxes, reducing its overall net earnings. Since the average market investor is aware of this, they are not going to suddenly reduce the market price for Coke. Thus, if the market price remains stable and the earnings drop dramatically, the ratio inversely changes. In effect, 2018 is an anomaly. By the way, this is one of the flaws of the PE ratio and is explained in detail in the lesson about price to earnings in the Business Ratios section of Value Investing on this website.
From above, the market is willing to spend at least 20 times earnings to own this stock. Current earnings plus some excess cash flow total around $2.24 per share. At a PE of 20, that makes Coke’s market value approximately $45 per share. Value investors don’t want to buy stock at commonly accepted market prices, which just means that you will only earn dividends, and although the yield will be good, value investors desire strong overall returns. To achieve this, the buy price, which is set below intrinsic value, must be dramatically (> 5%) less than intrinsic value. With Coke, given the unusual quality this company provides to its shareholders, a price differential, including the additional 5% for margin of safety, must exceed 25% in order to justify the risk associated with the holding period. An illustration is warranted here.
Assume that a fair market price is $45 per share based on a minimum 20:1 P/E ratio. Given the risk of time to recover to a fair market price, a 25% discount is required to buy the stock. 25% of $45 is $11.25. Thus, to buy this stock, the value investor sets the buy point at $33.75 per share. This buy point is at least 5% less than the intrinsic value. This makes intrinsic value approximately $35 to $36 per share. Take note how this is at the low end of the range established in the prior section.
Thus, using PE ratios as a barometer of value, discounting the minimum average PE ratio by 25% from the most recent look-back period of five years can provide some insight into intrinsic value. If the minimum PE ratio increases to 25:1, the fair market price increases to $56 per share. A 25% discount puts the buy point at $42 per share. If this is at least 5% below intrinsic value, then intrinsic value is estimated at $44 per share. Notice how this estimate is well above the expected intrinsic value range of $36 to $41. However, it is within the overall range calculated in the prior section (Discounted Earnings Liberal Approach Price).
A Side Note
Please take notice of something interesting here, the discount explained above is different than the discount used with the Discounted Earnings/Cash Flow method in the prior section. Some readers will ask, Why is it that this discount in this section is almost four times greater than the discount used in the prior section (discounted earnings/cash flow). There is an outright difference between the two uses of the term ‘discount’. In the prior section, discount is tied to multiple risk factors AND extrapolated over an extended period. Whereas, in this section, the discount is instantaneous and is driven by a limited set of factors that can impact its value. In this case, the value investor’s risk is a very short period (six or fewer months), and the value investor needs to have a dramatic change in a very short period. In the prior section, the different variables of growth and earnings are addressed over a very long time frame, 30 or more years. The result is this: as time decreases, the discount rate must adjust accordingly, i.e., increase.
Using a 25% discount of a minimum expected market PE ratio is just one tool to provide additional confidence in the resultant values from the various intrinsic value formulas used when determining an intrinsic value range. Think of it as a quick objective outcome.
Market Appraisal
Another objective tool is to ‘Appraise’ the company. Naturally, appraising Coca-Cola would take several years. Thus, to conduct a quick appraisal, one must use reasonable expectations related to determining the fair market value of Coke’s assets. A quick look at Coke’s assets identifies the following on 12/31/21:
Current Assets $22.5B
Investments $18.4B
Fixed Assets $9.9B
Intangibles $41.3B
Most of the intangibles are Trademarks and Goodwill. Basically, Coke purchased these rights over the last 70 years to gain market share for non-alcoholic beverages. Fixed assets reflect manufacturing, distribution, and office facilities. Investments are mostly equity positions in other beverage companies, geographical territories, and distribution venues. Since assets are recorded at cost under Generally Accepted Accounting Principles, their step-up in value to fair market value is not done and is not reported on the balance sheet.
The step-up to fair market value is very effective with fixed asset-intensive businesses like real estate, utilities, shipyards, etc. Coca-Cola’s balance sheet relies intensively on intangibles. There is a very involved process to appraise intangibles. Thus, using this appraisal tool isn’t going to work with evaluating Coke’s overall asset position at fair market value less its liabilities to determine net aggregated value, which is one way of measuring intrinsic value. A good illustration of how market appraisal effectively calculates intrinsic value is with a REIT Please read Intrinsic Value of Essex Property Trust to learn more.
Another alternative is required.
Price to Book Ratio
A third objective tool is an old method called ‘Price to Book Ratio‘. This is a valuation ratio that emphasizes the importance of the book value for a company. It has many flaws and can be easily misinterpreted. But in general, it is more effective with highly stable operations, ones with an extremely extended history of exceptional performance.
Book value reflects the net equity position of the company divided by the number of shares in the market. For Coke, it slowly improves from year to year. Coca-Cola generally prefers to distribute earnings and not reduce debt or improve the overall financial position of the company. It has such an outstanding history with sales and a top-rated (if not one of the best among all companies) gross margin, which exceeds 60% of revenue. Thus, the company will perform very well year after year. Coke doesn’t take its earnings to improve its financial position; it pays out 80% of what it earns in the form of dividends. Thus, very little is used to improve the book value per share (retained earnings improvement).
This does, however, produce a highly reliable market measure with the price-to-book ratio. With this stable market measure, a value investor can preset a discount to buy. This is no different than how a house flipper will determine the maximum amount they are willing to pay for a piece of property, given the market value of similar property. For a value investor, a net cumulative 40% discount is considered reasonable and necessary to make a good return on an investment. Thus, if the current price to book ratio is 12, a value investor is interested in buying when the price to boot ratio drops 40% or to around 7.2 price to book ratio. Again, think about a house flipper’s business dynamics. It costs extra money to purchase and sell the investment; secondly, the house flipper’s real risk is time. How long will it take to sell this home? In addition, he has to invest some money to improve the property. Most house flippers buy distressed property at about 40 cents on the dollar and invest another 20 cents on the dollar to get the property ready for sale. Then it is just a matter of time to get it sold. Their total investment is around 60 cents on the dollar. So, just like a house flipper, a value investor considers buying the current investment with a 40% discount (paying 60 cents on the dollar).
During the first quarter of 2022, Coke’s price-to-book ratio is around 11.2; a 40% discount means that Coke’s intrinsic value is about 6.72 times of price to book ratio. The current book value is $5.78. Thus, intrinsic value will approximate $5.78 X 6.72 or $38.85.
Reasonable and Objective
Overall, two separate, objective, and reasonable approaches were used to validate the intrinsic value range established in the prior section. The first involved discounting the market price to earnings ratio by at least 25%. Again, higher stable operations, such as Coke, warrant a minimum market price discount of at least 20% in order for a value investor to take the risk and tie up capital for an unknown period while they wait for the market price to recover to the long-term price to earnings ratio. The more stable and less volatile the entity, the deeper the discount the value investor should consider when determining intrinsic value tied to price to earnings.
The second tool used is similar, but this tool is tied to the book value. Review the company’s price-to-book value, and look at the history of the book value. For entities with very strong dividend payouts, the book value rises slowly over time. In contradiction to this are entities that limit their dividend payouts to under 30% like Disney. The retention of the difference forces the book value to step up significantly from one year to the next. In their case, their market price to book value hovers from 1:1 to as high as 4:1. Whereas Coke pays out almost all its earnings as dividends, their price to book value rarely goes below 7:1. Look at Coke’s price to book history over the last 10 years:
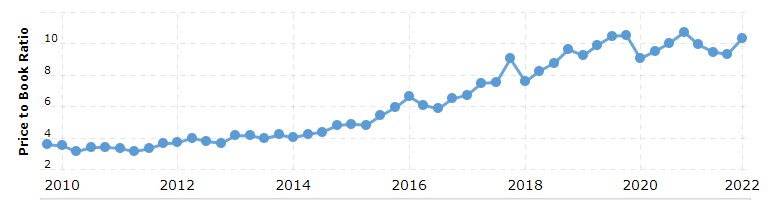 During the recession period of 2008 through 2011, the price-to-book ratio was low. Then it slowly rises to today’s 11 to 1 ratio.
Notice how it hasn’t gone below a 7:1 ratio since in 2016 to 2017 time frame. Thus, buying this stock at a 6 or 7 to 1 price to book ratio is considered an excellent buy, assuming earnings have not decreased.
Both independent tools indicate that intrinsic value in the upper 30s to low 40s is REASONABLE and OBJECTIVE. This matches the RANGE of intrinsic value covered in the prior section. The key is to get a warm fuzzy that the intrinsic value range determined withstands many separate tests, and although the tests may indicate values just outside the range, the delta involved isn’t unusual or dramatic. Therefore, it is with a strong degree of certainty that Coca-Cola’s intrinsic value is indeed between $36 and $41 per share. Thus, buying at about 5% discount to intrinsic value to provide some margin of safety is acceptable and pretty much guarantees the investor a good return on their investment. A buy price between $34 and $39 per share is going to reward the investor well. The market will return to high price-to-earnings at some point for this stock, and when it does, the value investor is going to be rewarded well.
The real value is the fact that Coca-Cola keeps earning money from one year to the next, even during a recession or some unusual event, like COVID. These continuous earnings mean that the intrinsic value is constantly improving. This tells any investor that intrinsic value is FLUID.
Intrinsic Value – Fluid with Time
One of the top 30 companies in the world is McDonald’s. McDonald’s average net profit percentage is in the low 20s. Thus, it is a top-notch producer of profit for its shareholders. Each quarter, McDonald’s generates about $2.50 per share. Therefore, over 92 days, it is netting 2.7 cents per day for each share. Intrinsic value is tied to the 2.7 cents per day. The current intrinsic value assumes earnings of 2.7 cents per day. When McDonald’s adds a new location, it earns a little bit more for that share each day. Over time, the earnings per day per share improve to 2.8 cents. Thus, each day, the intrinsic value is constantly changing. With high-quality companies, it generally tends to improve over time.
This fluid state requires the value investor to modify the intrinsic value on a regular basis. Customarily, it is done each year when the annual report is released. With some companies, this intrinsic value changes slowly. Coke is one of them. Since Coca-Cola pays out almost all of its earnings as dividends, what is earned as profit has limited reinvestment utility; as such, future growth is slow and sometimes feels lethargic for a shareholder. A value investor must be aware of this and recognize that intrinsic value will improve, but very slowly over time.
This ties to the market price too. The market price doesn’t fluctuate dramatically for Coke. Look at Coke’s market price over the last ten years:
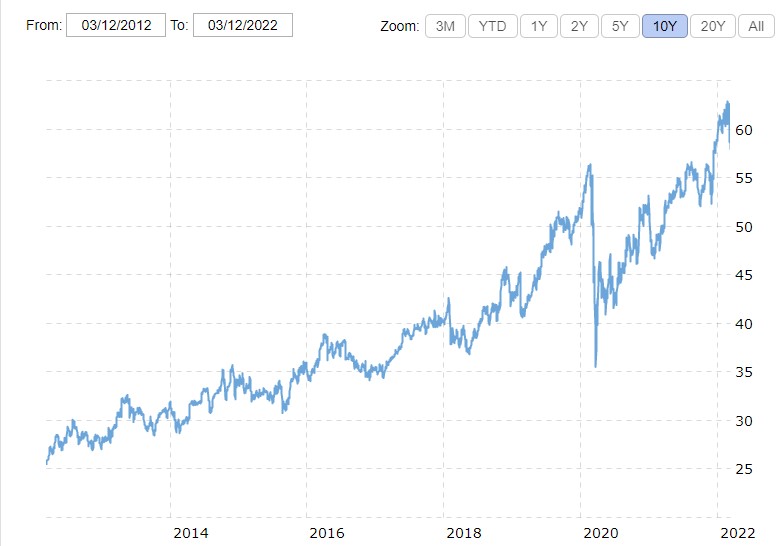
Coke’s market price has improved from $25 a share to $60 a share over 10 years. This is a direct reflection of its ability to earn a profit. The key is volatility; it simply does not exist with this company.
Yes, Coke’s stock price indeed dropped more than 25% in March of 2020. However, every publicly traded company saw its share price drop from mid-February through March due to the COVID pandemic. Coke’s market price dropped more than 30%. But at no other point along this graphical timeline has Coke’s market price changed more than 15% in a short period, or for that matter, even over long time frames. It has continuously improved (with the noted exception). Intrinsic value follows the same curve over the same time frame. When Coke’s price dropped suddenly due to COVID, intrinsic value did not drop. Intrinsic value is tied to the long-term picture; market price is a today value.
This is just another example of why highly stable operations are coveted by all investors. Value investors have to recognize that opportunities to buy low with highly stable operations are few and far between these market price points. This brings into play core principle number four, patience.
With Coke, intrinsic value is constantly improving; slowly but surely over time. Intrinsic value is FLUID.
With some companies, intrinsic value can have severe changes in value from one year to the next. As an example, Union Pacific bought back some of its stock during 2021. It paid much more than the intrinsic value to buy back this stock. In effect, the company used cash, $7.3 billion, to buy back stock. Aggregated intrinsic value decreased $20 billion from $120 billion to $100 billion. This outflow of assets shifts existing value off the balance sheet. This, in turn, reduces intrinsic value to existing shareholders, resulting in increased risk too.
Value investors must be aware of the various activities that can increase and decrease intrinsic value. These actions affect intrinsic value from one quarter to the next, one year to the next. Thus, intrinsic value is FLUID.
Join the Value Investment Club This site's Value Investment Club (Membership Required) utilizes a Value Investment Fund model with an annualized 23.3% return over a SIX and THREE QUARTER-YEAR history. It has grown from a starting basis of $100,000 and is now $411,989 before taxes of $91,166. This is a 19% annualized return after taxes. Membership provides instantaneous access to time-sensitive information. Membership provides: Value investing, in its simplest terms, means buying securities at a low price and selling them at a higher market value. Value investing is defined as a systematic process of purchasing high-quality stocks at an undervalued market price, quantified by intrinsic value and justified through financial analysis, then selling the stock promptly upon market price recovery. Membership gives the reader full access to all information on this website. Act on Knowledge.
Intrinsic Value – Summary
There are three rules with intrinsic value. First, intrinsic value is a range of values. Different elements of the various intrinsic value formulas can vary the outcome from relatively conservative estimates to high outcomes with more liberal element application. The key here is to narrow the range to a reasonable zone. This is where rule number two comes into play. That range of value should be reasonable and objectively verified. It is important to utilize other tests and tools to ensure that the range is reasonable and not extreme. Extreme results will result in either no opportunities to invest in the particular security, or when one does invest, it will not result in a good return. The more tests an investor can apply against the intrinsic value range, the more objective the outcome gets and the more confident the value investor is with the range.
Finally, a third rule exists. Intrinsic value is in a constant state of change; it is fluid in price. The mere fact that the company operates each day changes the value incrementally each day. As profits improve, intrinsic value goes up. In some cases, the governing body of the company can make decisions that dramatically affect intrinsic value. Readers of financial statements must be on the lookout for these intrinsic value impact factors.
Most importantly, intrinsic value exists within a RANGE of values; it should be REASONABLE and OBJECTIVELY verified; in addition, it exists in a FLUID state and can instantly change.
This is the first article in a series on intrinsic value. The series continues with the balance sheet approach to calculate intrinsic value. In addition, there is another article that covers income statement intrinsic value formulas. After that article is another explaining how to determine intrinsic value using cash flow. There are still others, including utilizing business ratios and determining intrinsic value utilizing key performance indicators. The final article sums all this up. For the reader, the key is that there is NO SINGLE UNIVERSAL INTRINSIC VALUE FORMULA. Value investors must apply several formulas and test the results to gain high confidence that the intrinsic value range is valid. ACT ON KNOWLEDGE.