
Intrinsic Value – Balance Sheet Fundamentals

The key to understanding intrinsic value is grasping the fundamentals of the balance sheet. The balance sheet reflects the lifetime to date accrued net worth of that business entity. For the value investor, understanding how a balance sheet is laid out, works, and how it reports net worth takes the investor to the next level of confidence with their buy/sell model for any potential investment. Simply stated, understanding the balance sheet places the value investor ahead of other types of investors. Knowledge about the balance sheet for your investment can provide all the necessary confidence you need to make good decisions when setting buy and sell points for that company’s securities.
 In essence, the balance sheet is a scale. Accounting ensures the scale always stays in balance. It is laid out with two sides; on one side of the scale are all the existing assets of the company. The other side informs the reader how those assets are funded. More mature or well-managed companies fund assets with the lifetime earnings to date that are retained. Some companies borrow money to pay for the assets. As an example, most people don’t realize this, but McDonald’s funds the entire asset side of the scale with borrowed money and then some. Yet, McDonald’s is one of the top 30 companies in the world. Thus, how can McDonald’s have any intrinsic value when it owes more money to creditors than they have in assets?
This is why value investors must have a good fundamental understanding of how the balance sheet works.
In addition, the balance sheet acts as a report. It informs the reader what kind of assets the company owns, and it details how those assets were funded. Understanding this fundamental reporting format allows the value investor the ability to quickly get to the core reason the company has value. In many cases, understanding this reporting format allows the reader to easily determine a viable range of expected outcomes for intrinsic value.
Understanding the balance sheet fundamentals allows investors to not only determine the core value of a company, but it also assists the investor in determining which particular intrinsic value formula is the most reliable to use. You must understand these fundamental balance sheet relationships to assist in determining the best intrinsic value formula. In most cases, the balance sheet will provide the intrinsic value (subsequent articles) for the company. But without this knowledge, an investor can’t possibly have a high level of confidence in intrinsic value formulas. It all starts with understanding the fundamentals of the balance sheet.
Fundamental understanding of the balance sheet starts with keying in on the concept of balance. Once this core principle of balance is comprehended, an investor must then understand that THERE IS NO UNIVERSALLY ACCEPTED PRESENTATION FORMAT. There is a simple balance sheet presentation format that is ingrained into the formal education of accountants, but, at the public securities level, industries have set how a balance sheet is presented. What is important here is that although the industry’s balance sheet format is different, it is still easy to comprehend this alternative presentation format and how it ties back to the basic presentation format.
Finally, after grasping how a balance sheet is laid out and works, a value investor begins to appreciate each industry’s presentation format. Now it is time to key in on the real reason all this is so important: matching the most important asset on the balance sheet to how this entity makes its money. What are the one or two most important assets, and how they are presented aids the investor in determining value. How does a value investor discover this asset, and how does one determine its value?
Each section below goes into the set of core fundamentals of a balance sheet. When done, the reader should be able to break any company’s balance sheet out into the core groupings and quickly ascertain the proper format for the company one wishes to invest in. From there, a value investor will quickly key in on the most important asset that makes this company go; what is the one single most important asset that provides all that wealth? With this understanding, a value investor can more easily derive intrinsic value and have extreme confidence in the intrinsic value outcome.
Intrinsic Value – The Balance Sheet
The balance sheet is one of the five key financial reports. It is a required presentation with the company’s annual 10K report filed with the Securities and Exchange Commission. Most publicly traded companies also include the report with their quarterly releases. The balance sheet identifies existing assets along with the sources of funds to finance the company. Sources of funds include liabilities, loans, and money fronted by the shareholders and other equity stakeholders. Generally Accepted Accounting Principles (GAAP) and the accounting profession’s dual-entry accounting system force the balance sheet to exist in a state of equilibrium, thus the expression, ‘the balance sheet’.
As an investor, it is important to understand the primary purpose of the balance sheet; the balance sheet reflects the lifetime to date financial position of the company. The income statement only reflects the accounting year, whereas the balance sheet is just a snapshot of a single moment in time, which is identified by the date of the report. The balance sheet states the book value of all assets and the book value of all debt (current and long-term), along with the resulting aggregated position of all stakeholders (Preferred Stock, Minority/Joint Owners, Treasury Stock, and Shareholders). It starts with a very simple equation:
ASSETS = SOURCES OF FUNDS (the core balance sheet)
This is then broadened out to reflect the two major sources of funds, which have different risk levels:
ASSETS = LIABILITIES (preferred rights, less risk)
plus
. EQUITY (subordinate position to liabilities, greater risk)
In effect, the balance sheet is a three-part formula. Part One reflects assets such as cash in the bank, receivables, fixed, and other assets. Some of these assets are funded by short-term liabilities, while others are funded with long-term loans (notes). Subsequently, liabilities are Part Two of the formula. The final part is, of course, equity. Equity in a simple state refers to what the shareholders have invested in the company. This investment is the initial purchase price paid to start the company, plus the lifetime earnings to date, referred to as ‘retained earnings’. Recall, each year as the company earns a profit, any profit not used to pay dividends or buy back stock (treasury stock) is then accumulated in an account called retained earnings. The result is:
ASSETS = LIABILITIES + EQUITY
An easy observation is that this formula can be rearranged to state the value from the perspective of just the shareholders:
ASSETS minus LIABILITIES = EQUITY
This presentation format is not referred to as the balance sheet, but as ‘Net Assets’. It is important for the reader to understand that there is a naming difference involved, as often different wording is used to identify the various presentation formats of the balance sheet. The balance sheet refers to the core formula of assets equals liabilities plus equity. When referring to assets minus liabilities equals equity, accountants and finance folks refer to this as ‘Net Assets’. Notice how net assets equal assets minus liabilities. Thus:
NET ASSETS (assets minus liabilities) = EQUITY
This is key, value investors more often use the term ‘Net Assets’ when talking about value than the alternative term of ‘Balance Sheet’. Mathematically, though, the two terms are referring to the same financial equation; specifically, what is the value of the equity position of the company? An illustration will assist the reader in understanding this relationship:
This is the balance sheet for a real estate investment trust (REIT), American Homes 4 Rent, Inc. This company owns 56,400 homes throughout the United States. This is their balance sheet as of 12/31/2021.
American Homes For Rent Inc. Balance Sheet 12-31-2021
Click the above link to open in a separate tab.
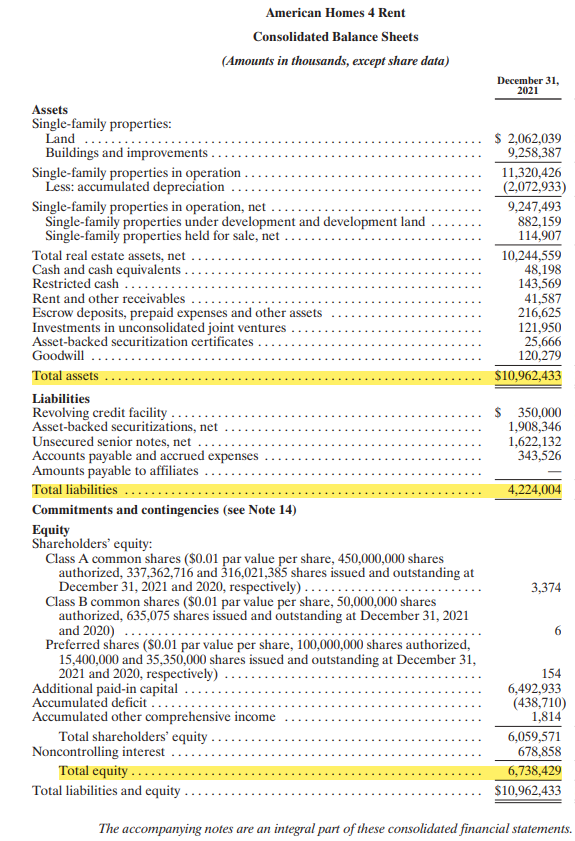
Notice the three highlighted summation amounts? The first is assets at $10.962 billion. Liabilities equal $4.224 billion, and Equity equals $6.738 billion.
Thus, the balance sheet formula (accountant’s perspective) is:
ASSETS = LIABILITIES plus EQUITY (sources of funds)
$10.962 B = $4.224 B + $6.738 B
Whereas, value investors will state that the net assets are $6.738 billion.
ASSETS – LIABILITIES = EQUITY
$10.962 B – $4.224 B = $6.738 B
Notice also that the very bottom financial value is referred to as ‘Total liabilities and Equity’. This value equals total assets. This goes back to the primary goal of the balance sheet: the two sides must be in balance; they must match.
ASSETS = SOURCES OF FUNDS
$10.962 Billion = $10.962 Billion
Again, this is extremely important; accountants use the term ‘Balance Sheet’ whereas investors, specifically value investors, will use the term ‘Net Assets’. Please remember, they are saying the same thing, but just from a different perspective.
Intrinsic Value – Balance Sheet Presentation
When accountants go through their undergraduate studies, they are taught that the balance sheet has a certain presentation format. Of course, the primary form matches the core formula of assets equals liabilities plus equity, the two sides of the balance sheet. The core model used in studies is the traditional retail model. Here, the model breaks out each side of the balance sheet into three subsections as follows:
ASSETS
. Current Assets $ZZZ
. Fixed Assets Z,ZZZ
. Non-Current Assets ZZ
. Total Assets $ZZ,ZZZ
LIABILITIES
. Current Liabilities $ZZZ
. Long-Term Liabilities Z,ZZZ
. Total Liabilities Z,ZZZ
EQUITY Z,ZZZ
. Total Liabilities & Equity $ZZ,ZZZ
Notice how this model fits perfectly with the core concept of the balance sheet structure explained above, ASSETS = LIABILITIES + EQUITY.
In general, most companies try to mimic this presentation model as best they can, but each industry utilizes its own presentation format. Overall, the format each industry utilizes matches the core formula; it’s just that they may present it differently. Go back to the REIT above. American Homes 4 Rent uses a slightly modified model. In their case, they focus on fixed assets as the primary asset. Notice how total real estate dominates the value of total assets. This is their basic presentation format:
ASSETS
. Total Real Estate $10.245 Billion
. Current Assets .597 Billion (cash, receivables, deposits, investments)
. Non-Current Assets . .120 Billion (goodwill)
. Total Assets $10.962 Billion
On the liabilities side, preference in hierarchy is given to secured notes over unsecured notes. In the traditional presentation format, unsecured liabilities are listed first, and then secured loans are listed based on inverse seniority.
Again, each industry presents its balance sheet in its format. As a value investor, it is so important to understand this presentation format to better grasp value when it comes time to determine intrinsic value.
There is another aspect of the presentation format that is important for value investors to understand and appreciate. Large companies, those in the top 2,000 in the United States, tend to report the most important assets first, along with their prioritized liabilities. Look at the REIT’s presentation above. Almost all REITs present in a similar format; they list their net real estate book value (cost basis less depreciation taken to date) as the first asset on the books. Whereas banks list their cash available, then their portfolio of securities they own, and loans they’ve made. Look at Bank of America’s format:
 For Bank of America, the presentation format goes like this:
ASSETS
. Cash $348.221 Billion
. Federal Funds/Trading Accounts/Derivatives 540.288 Billion
. Debt Securities 982.627 Billion
. Loans Made 966.737 Billion
. Other Assets (fixed, goodwill, other) 331.622 Billion
. Total Assets $3,169.495 Billion
($3.169 Trillion)
With banks, they generally list their assets based on liquidity, from the most liquid to the group that will take the longest to liquidate in case of termination of operations. For banks, the government grades the quality of a bank based on its ability to liquidate its assets; thus, the balance sheet reflects this governmental compliance format.
The liabilities section is similar; it is presented in the format of priority to repay. Existing customer deposits are first at $2.1 trillion, and then the remaining forms of liabilities are based on their time windows.
All the banks follow this pattern with their balance sheet. Again, the presentation format is tied to the core concept of balance first; assets in the upper half and liabilities and equity in the bottom half.
Each industry’s presentation format assists value investors with determining intrinsic value. When you understand what the industry presents as the most important asset over others and why, it helps to focus on what matters the most to that particular industry.
With REITs, it is real estate that is the most important asset, and as such, it gets reported first. With banking, it is liquidity, because it is required by law. Thus, banks want the readers to see that they have adequate cash and other easily liquifiable assets (government bonds and debt securities) in their portfolio to cover any ‘run’ on the bank.
For value investors, it is so important to understand this relationship of what it is that the company does and how its key assets allow it to generate revenue. The company wants the balance sheet to reflect, by prioritizing, those key assets first.
Intrinsic Value – Matching the Balance Sheet Against the Company’s Purpose
A key fundamental of value investing is understanding how the balance sheet presents the priority of the particular company within a certain industry. Each industry is different, and as such, there is an asset allocation or alignment that matches that industry’s purpose. Look at the difference in presentation format between the two industries above:
REIT’s Banks
Net Real Estate >92% Cash 10 to 15%
Cash 3% Federal Notes/Securities >50%
Other 4% Loans 30%
Other <10%
Look at what the company does; REITs collect rents; thus, real estate as an asset is the most important asset to own. It is difficult to collect rent in cash. Whereas a bank’s primary purpose is to generate net interest income. Interest comes from debt securities (bonds) and loans. In their case, they want to maximize how much of their assets are lent out to debtors. The only reason they list cash first is that they have to meet a minimum cash position (liquidity) in relation to the total assets to be in compliance with the license they are granted by the Federal Reserve and other federal agencies. But immediately after reporting this cash position, the primary asset is listed, securities and loans that make the bank money via interest payments as its revenue.
As a value investor, key in on this concept, and it will help you to gain a better perspective of the overall intrinsic value for a company. At this point, an in-depth illustration will assist the reader with a better understanding of this fundamental principle of determining intrinsic value.
The financial sector of the economy is divided into several industries. One of those industries is insurance. Insurance is further segmented into different types. Some companies focus strictly on life products, while others health insurance. But there is one that all of us understand and recognize: property and casualty. Customarily referred to as the P&C arm of insurance.
Unlike the other forms of insurance, which have a steady pattern of benefit payouts, P&C does experience some peak payouts at certain times throughout the year for natural events (tornadoes, hurricanes, flooding, wind, and hail). Thus, this type of company must have reserves that can be easily cashed and cashed without undue additional costs. Look at their assets section of the balance sheet:
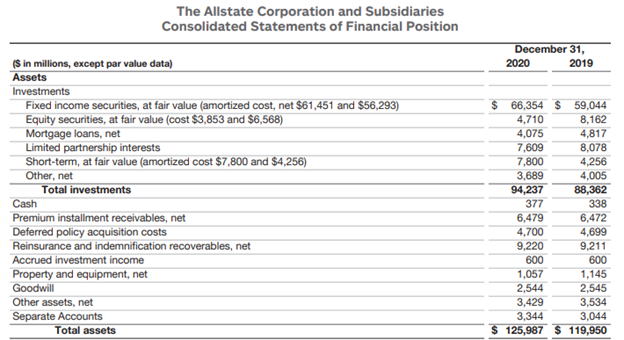
Notice that the very first grouping of assets is investments. Three-fourths of all assets are investments. Within this investment group, more than two-thirds are fixed income securities (bonds). The bonds are a key source of cash from the interest income (see articles within the Insurance Pool explaining this). Bonds are the key asset of a P&C company.
Look at the cash position, it is a measly $377 million (.3%) out of the $126 billion of assets. Insurance companies don’t need to hold cash; they just need access to cash. Bond and equity securities are an excellent, easily convertible source of cash.
A property and casualty insurance company’s asset arrangement is strictly about the ability to convert assets into cash to meet forecasted catastrophic events. Think about this from the perspective of intrinsic value. Recall, intrinsic value is tied to the core value of a company. In this case, for a P&C operation, intrinsic value is strongly aligned with the quality of the liquid assets.
There is some additional value related to earnings, but the balance sheet identifies the real intrinsic value of insurance operations. To validate this value, look at Allstate’s liabilities:
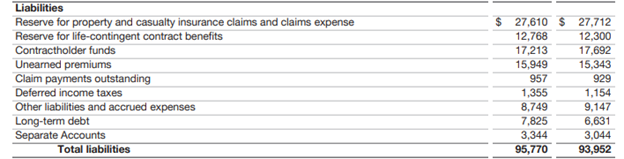
The first line is the standard P&C expected obligation of Allstate; they believe that in the upcoming year of 2021 and the future tied to longer-term P&C policies, Allstate will need to pay out about $27.6 billion to settle damage claims. Since most P&C insurance companies are not pure P&C, most do also sell life insurance, the second line is the projected lifetime amount they will pay out for existing life insurance contracts. The third line ties to their annuity products.
The fourth line is the standard arrangement with their customers. When you purchase insurance, you agree to a certain ‘Annual’ premium, and customers prepay for the upcoming year. In this case, almost $16 billion has been paid and not amortized to the revenue section of the income statement at year-end. Most of these policies are for P&C policies for corporate-sized accounts and not necessarily at the individual level. At the individual level, customers agree to pay the premium in the near future, and this in turn is an asset on the balance sheet; thus, look at the line ‘Premium Installment Receivables, Net’ for $6.5 Billion in the asset section above.
Then there is a line for claims made but not disbursed yet, deferred taxes, and other common forms of corporate liabilities (payables, notes, etc.). Altogether, Allstate estimates it owes about $95.8 billion, of which most of this will be settled within a few years.
The key relationship is this: Allstate’s core investments plus existing cash plus receivables due from customers equals $101.1 billion; its expected obligations are about $95.8 billion; thus, there is a $5.3 billion delta to the positive here.
In the aggregate, Allstate’s assets less liabilities are an estimated net assets position (remember from above, investors use the term ‘net assets’) of about $30.2 billion.
There are 304 million shares outstanding (trading) in the market on 12/31/2020, plus another 26 million assigned to a benefit package for employees. This means each share on a fully diluted basis has a book value of $91.50.
However, book value DOES NOT equal intrinsic value. With P&C operations, intrinsic value is commonly within .9 to 1.4 times book value. Rarely, if ever, will intrinsic value exceed 1.5 times book value. The reason is straightforward, P&C operations use actuarial science and know within a few million dollars their full obligations related to the various policies they carry. Thus, given the risk of dramatic catastrophic losses (imagine seven or eight hurricanes, a large forest fire, several hailstorms in one year), it is quite possible to have to utilize net asset value to cover these unforeseen events; this, in turn, limits the upper range of intrinsic value for an insurance company.
Any unusual activity will quickly diminish the intrinsic value of a P&C insurance company. Therefore, intrinsic value is merely the book value plus a few years of net earnings from the income statement. The extenuating risk factors associated with catastrophic events in excess of expected volume will dramatically impact intrinsic value. Therefore, intrinsic value will never exceed 1.5 times book value for P&C insurance companies.
For the reader, this site’s facilitator estimates intrinsic value for Allstate at $102 per share with a buy price of $81 per share.
The key is this: the balance sheet is customarily formatted to facilitate a better financial understanding of the company related to the industry in which they operate. Understanding these core fundamentals of how a balance sheet is laid out, formatted, reported, and presented assists the investor with determining intrinsic value.
Join the Value Investment Club This site's Value Investment Club (Membership Required) utilizes a Value Investment Fund model with an annualized 23.3% return over a SIX and THREE QUARTER-YEAR history. It has grown from a starting basis of $100,000 and is now $411,989 before taxes of $91,166. This is a 19% annualized return after taxes. Membership provides instantaneous access to time-sensitive information. Membership provides: Value investing, in its simplest terms, means buying securities at a low price and selling them at a higher market value. Value investing is defined as a systematic process of purchasing high-quality stocks at an undervalued market price, quantified by intrinsic value and justified through financial analysis, then selling the stock promptly upon market price recovery. Membership gives the reader full access to all information on this website. Act on Knowledge.
Summary Intrinsic Value – Balance Sheet Fundamentals
Novice and unsophisticated investors place greater reliance on net profits over the balance sheet to determine intrinsic value. However, most so-called experts forget what intrinsic value means; intrinsic value refers to the universally accepted core value of a company. In many cases, this can be easily derived from the balance sheet. If not derived from the balance sheet, the balance sheet can act as additional assurance that certain intrinsic value formulas are superior and best suited given the balance sheet information.
Understanding how a balance sheet is laid out, works, and reports this information greatly assists value investors with determining intrinsic value. Gaining knowledge about balance sheet fundamentals takes a value investor to the next level of comprehension of value investing. Act on Knowledge.
This is the second part in a series about intrinsic value calculation utilizing the balance sheet. It is the first in a four-part series about the balance sheet and different intrinsic value formulas that are tied to the balance sheet. The next lesson in this balance sheet series delves deep into the analysis of asset matrices and the proper interpretation of that information. It also includes how to tie the asset matrix to the liability layout. Understanding this relationship allows the value investor to apply certain intrinsic value formulas, which are explained and illustrated.
For those of you who have not, it is a good idea to read the first part of this series. In addition, there are some other articles to assist with a more comprehensive understanding of the balance sheet.
- Intrinsic Value – Definition and Introduction
- How to Read a Balance Sheet – Simple Format
- How to Read a Balance Sheet – Equity Section Simple Format